The sample file EDFA Basic Concepts.osd shows the basic characterization of the Erbium Doped Fiber Amplifier (EDFA). There are three design layouts: Gain Spectrum, Gain Saturation, and Amplifier Noise. They enable the characterization of the gain, noise figure, and output power under unsaturated and saturated signal input regime. These layouts refer to the topics: Gain Spectrum and Bandwidth, Gain Saturation, and Amplifier Noise.
In this example, the amplifier performance is characterized by using sweeps for the input parameters of the amplifier. the layouts Gain Spectrum and Amplifier Noise sweep the signal wavelength, while the layout Gain Saturation sweeps the signal input power in order to evaluate the amplifier performance with the small signal input power (~ -30 dBm) and saturated input signal power (~ 0 dBm).
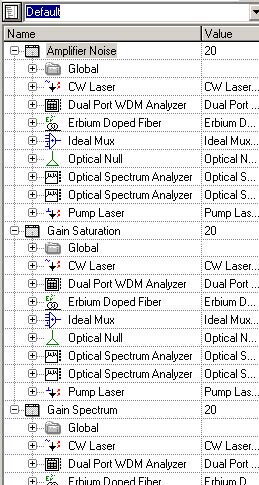
The three layouts created in this project file are shown in Figure 1. The basic layout used in each layout considers one Erbium-doped fiber stage setup in a co-propagating pump scheme. Erbium Doped Fiber model was used in this simulation. A single input signal operating in the C-band wavelength range is set in the laser source where small and large signal inputs are considered in the simulations.
Figure 1: Three different layouts created in this project file
For each design layout we have three graphs showing the Output Signal Power, Gain, and Noise Figure versus the Sweep Parameter. The components settings can be modified and the simulations repeated in order to analyze the differences observed in the amplifier performance as a consequence of the change in parameter settings.
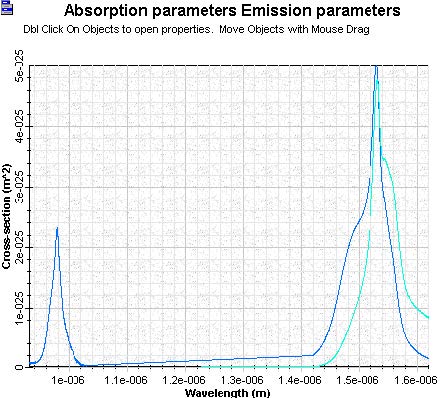
The absorption and emission cross section, input parameters which are critical in the numerical solution of coupled rate and propagating equations, are displayed in Erbium doped fiber component. Figure 2 shows the cross-section file used in this project file.
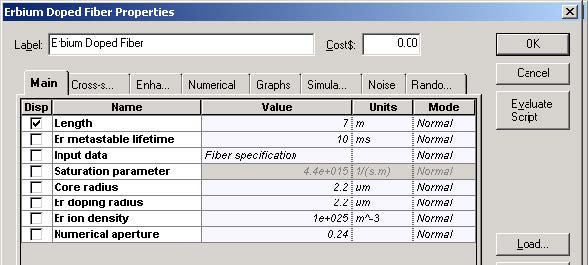
The cross section input files are characteristic to a specific fiber as well as the fiber dimensions specified in the Er doped fiber dialog box component, shown in Figure 3. However, it is interesting to change some fiber specifications in order to evaluate how it can modify the calculated results.
Figure 2: Cross-section file displayed in the Erbium doped fiber component Graphs
Figure 3: Er doped fiber specifications
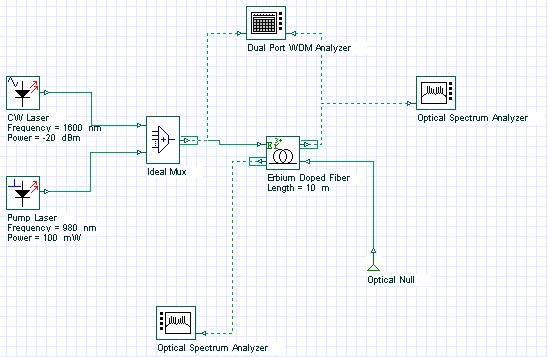
The basic layout used in the calculations to each layout is shown in Figure 4.
Figure 4: Layout used in the basic characterization of the Erbium doped fiber amplifier setup in one fiber stage and co-pumped by 980 nm laser diode
Layout Gain Spectrum
In this first layout named Gain Spectrum, the signal wavelength of the CW laser signal is swept from 1525 nm to 1600 nm, which enables evaluating the spectral gain and the bandwidth of the amplifier.
The spectral gain calculated to -20 dBm of input signal power is shown in Figure 5.
Figure 5: Gain versus signal wavelength given in [nm] units considering signal input power equal to –20 dBm
An additional graph which can be checked in the Gain Spectrum layout is the output power versus signal wavelength shown in Figure 6.
Figure 6: Signal output power versus signal wavelength given in [nm] units calculated to a signal input power equal to –20 dBm
Layout Gain Saturation
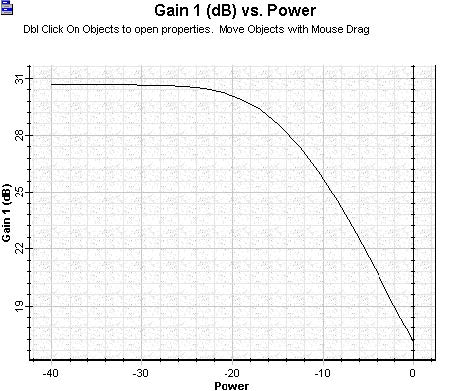
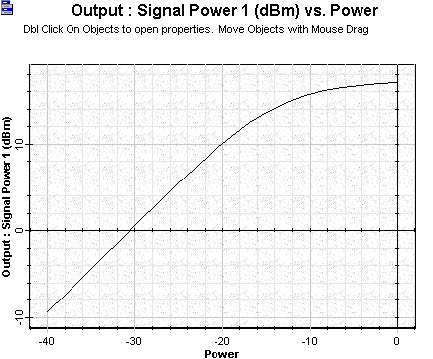
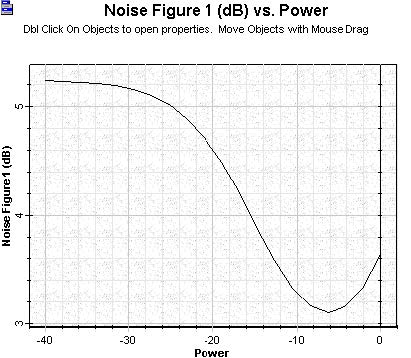
The layout Gain Saturation enables evaluating the amplifier performance as a function of the signal input power. The signal input power is swept from small signal to large signal regime, i.e. -40 dBm to 0 dBm. The amplifier performance given by gain, output power and noise figure are respectively shown in Figure 7, Figure 8 and Figure 9.
Figure 7: Gain versus signal input power
Figure 8: Amplified signal versus signal input power
Figure 9: Noise figure versus signal input power
Layout Amplifier Noise
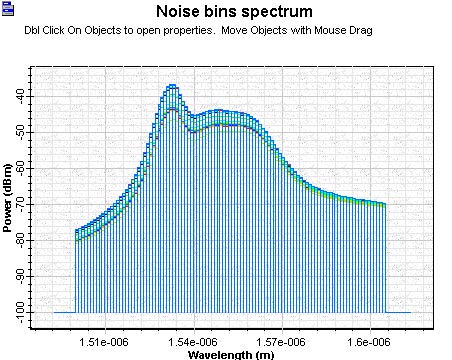
The signal wavelength is the parameter swept in this layout, which enables calculating the spectral noise of the amplifier. Signal and pump wavelength as well as the fiber parameters can be modified for further evaluation of the amplifier performance.
Figure 10: Noise bins as a function wavelength used in the calculations. Each curve in this graph resulted from the different iterations


![Optical System - Figure 5 - Gain versus signal wavelength given in [nm] units considering signal input power equal to 20 dBm Optical System - Figure 5 - Gain versus signal wavelength given in [nm] units considering signal input power equal to 20 dBm](https://optiwave.com/wp-content/uploads/2023/05/Optical-System-Gain-versus-signal-wavelength-given-in-nm-units-considering-signal-input-power-equal-to-20-dBm.bmp)
![Optical System - Figure 6 - Signal output power versus signal wavelength given in [nm] units calculated to a signal input power equal to 20 dBm Optical System - Figure 6 - Signal output power versus signal wavelength given in [nm] units calculated to a signal input power equal to 20 dBm](https://optiwave.com/wp-content/uploads/2023/05/Optical-System-Signal-output-power-versus-signal-wavelength-given-in-nm-units-calculated-to-a-signal-input-power-equal-to-20-dBm.jpg)
