The project file Booster Amplifier.osd shows the characterization of a booster/power amplifier setup in a single erbium-doped fiber stage heavily doped, bidirectionally pumped by two 980 nm pump lasers. A large signal input power is considered in this case, since high signal input helps to produce high output power, which is necessary to booster/power amplifiers. As a consequence, moderate gain will be observed in this case. The low noise figure requirement of EDFAs is not so critical in this case, because an increase in NF can be tolerated. It is important to mention that typical configurations of booster amplifiers include multiple Er-doped fiber stages.
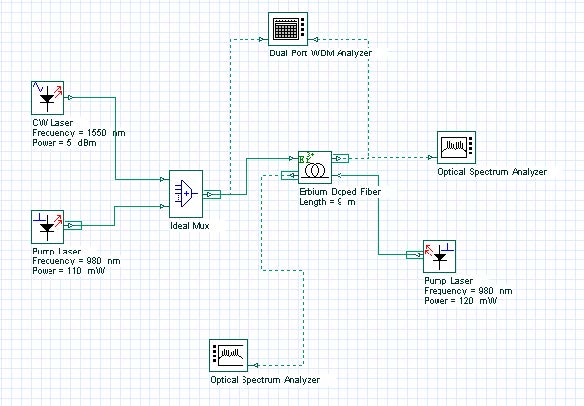
Figure 1 shows the layout of the booster amplifier. A bidirectional pump was used to exemplify the typical pump scheme observed in booster amplifiers. The Optical Spectrum Analyzer connected at Output Port1 shows the amplified signal obtained after calculating this sample file. The component Dual Port WDM Analyzer gives the calculated results generated by all the propagating signals, signals and pump.
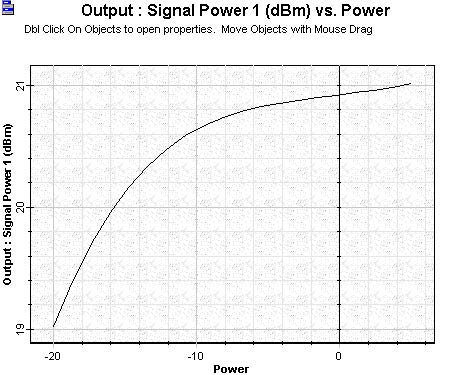
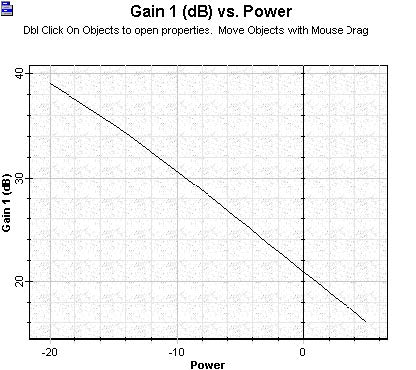
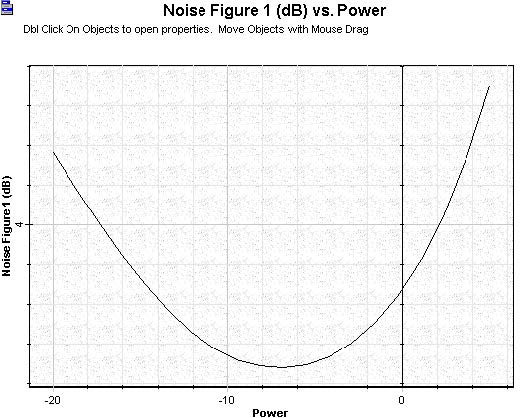
The output power, gain and noise figures calculated as a function of signal input power are shown in Figure 2, Figure 3 and Figure 4. It is possible to observe the gain being compressed as a function of the signal input increasing on Figure 3.
The noise figure curve calculated sweeping the signal input power to the booster amplifier utilized the same input parameters as before. There is a region in the curve in which NF is minimized as a function of the signal input considered. Observing graphs related with co- and counter-propagating ASE helps to understand how the noise figure curve appears as this shape.
Figure 1: Layout used in the Booster amplifier
Figure 2: Signal output power versus signal input power calculated to the booster amplifier
Figure 3: Gain versus signal input power calculated to the booster amplifier
Figure 4: Noise figure versus signal input power calculated to the booster amplifier
The power of both pump lasers co- and counter-propagating can be modified as well as the Er-doped fiber length. Fiber specifications can also be modified and the results compared with the previous case.


