This lesson demonstrates the performance of an amplifier (gain and noise) based on Giles and Desurvire [1] reference.
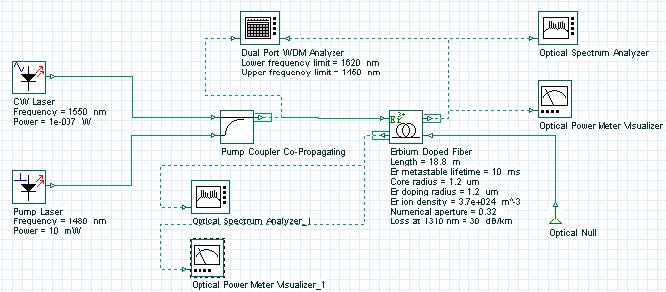
Figure 1: Layout of the system considered in the analysis of gain and ASE
The characteristics of noise and gain presented in Figure 4.b [1] are reproduced through the system shown in Figure 1.
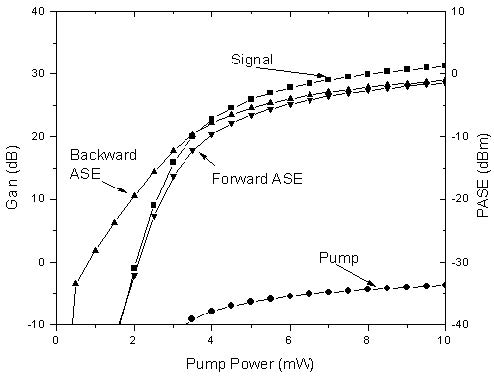
Figure 2 shows gain of pump and signal, and the power of backward and forward ASE as a function of the pump power. The parameters used in this simulation are displayed at Figure 1 and they are similar to the values presented in Table 1 [1], except for the values of the absorption and emission cross sections. Nevertheless, the results found are in good qualitative agreement with the paper.
Figure 2: Amplifier gain and ASE power versus pump for an Er3+-doped fiber amplifier
Note: Figure 2 equivalent to Figure 4 b) [1]
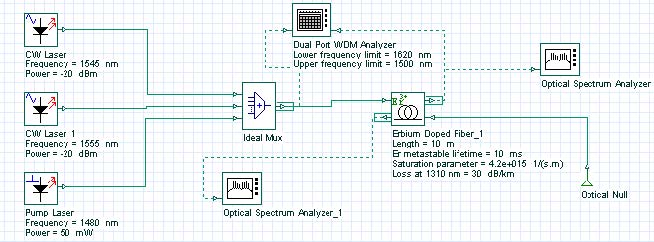
In this second case, the saturation effect of an amplifier is shown using two wavelength multiplexed signals at 1545 nm and 1555 nm. The system layout is shown in Figure 3 and the parameters used are similar to the parameters in Table II [1].
Figure 3: Layout of the system used to demonstrate the saturation of the amplifier
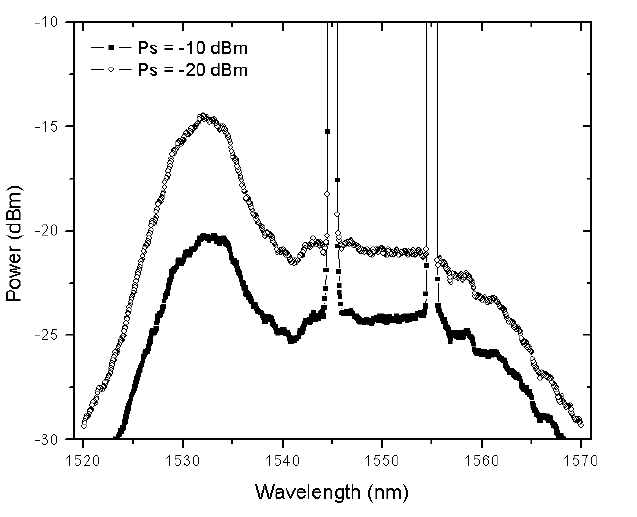
Figure 4 shows the gain compression in the two signals due to the increase in the input power, causing the saturation of the amplifier.
Figure 4: Output spectra of a two channel amplification of a saturated amplifier
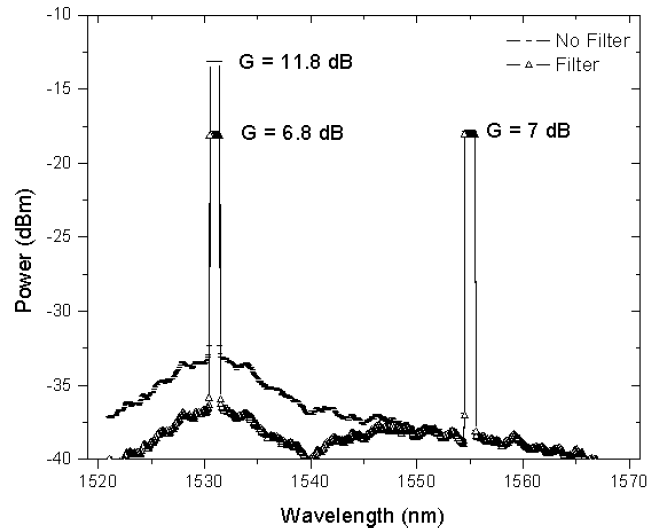
In the next case, the amplifier has two stages and a filter is inserted between the stages (see Figure 5). The effects of the equalization in the ASE are demonstrated.
Figure 5: Layout of the system used to demonstrate gain equalization in the amplifier
The EDF parameters used in this simulation are the same as in the previous case. A filter centered at 1931 nm is introduced in the middle of the EDF in a way that equalizes the gain of the two channels. Figure 6 shows the results with and without the filter. This figure is equivalent to Figure 7 in [1].
Figure 6: Amplifier gain-leveling with a filter centered at 1531 nm
The results of this lesson demonstrated a qualitative agreement with the results obtained by Giles and Desurvire in [1], considered to be one of the most important references in the EDFA modeling.
Reference:
[1]C. Randy Giles, and Emmanuel Desurvire, “Modeling Erbium-Doped Fiber Amplifiers”. IEEE Journal of Lightwave Technology, Volume: 9 Issue: 2, Feb. 1991, Page(s): 271 – 283.


