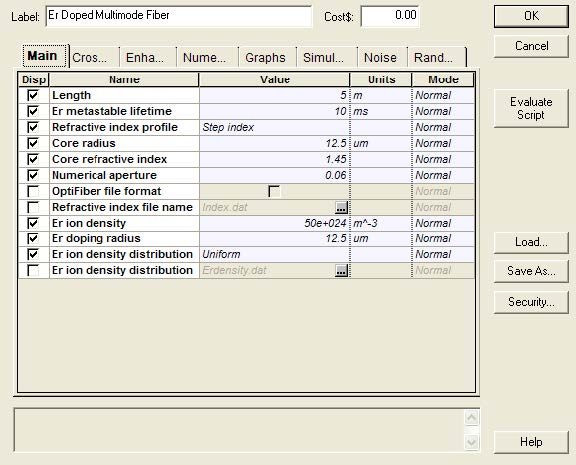
The Er-doped Multimode Fiber component was designed to allow the analysis of multiple modes amplification in large mode area fibers. The components are very similar to the original single-mode doped fiber amplifiers, however now the refractive index information and ion distribution profile can be defined by the user (see main tab parameters in the figure below).
Figure 1: Doped fiber parameters
Based on the parameters specified, the component’s mode solver calculates the modes supported for the signal, pump and ASE bands. The user can also define if all supported modes will be equally excited ( for pump and/or signal channels) or the power distribution ratio between the supported modes will be calculated based on coupling coefficients, in this case an initial optical excitation field has to be defined for pump and/or signal.
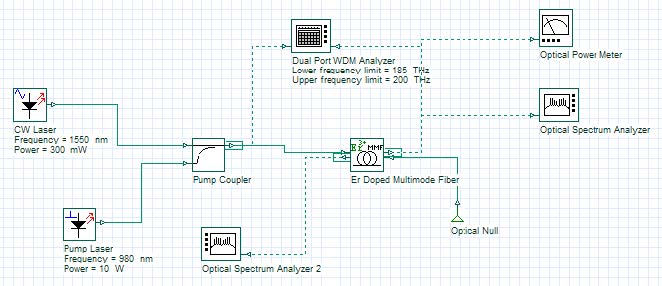
The following example shows an erbium-doped fiber (double clad fiber), where all signal modes supported are equally excited (MM EDFA ExampleAllModesEquallyExcited.osd).
Figure 2: System layout.
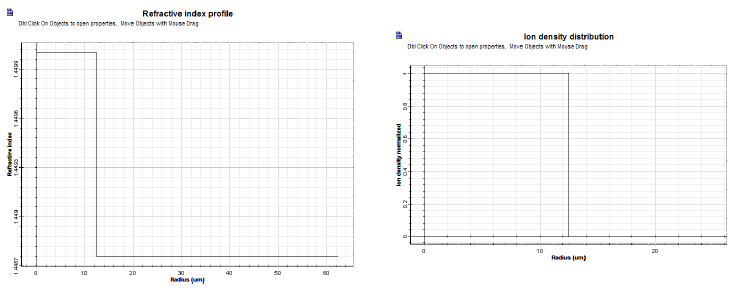
The refractive index profile (step index) and Er ion distribution (uniform) used are displayed in the figures below:
Figure 3: (a) Refractive index profile and (b) Ion distribution.
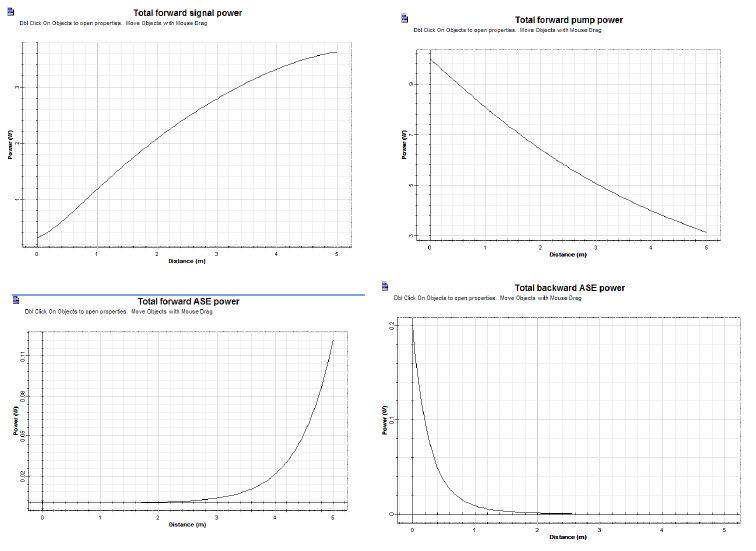
After running the simulation, the following results were obtained:
Total Signal, Pump, and ASE power evolution along the fiber length.
Figure 4: Total Signal, Pump, and ASE power evolution along the fiber length.
The fiber at 1550 nm (signal wavelength) supports 3 guided modes: LP01 and LP11 (two helical polarities).
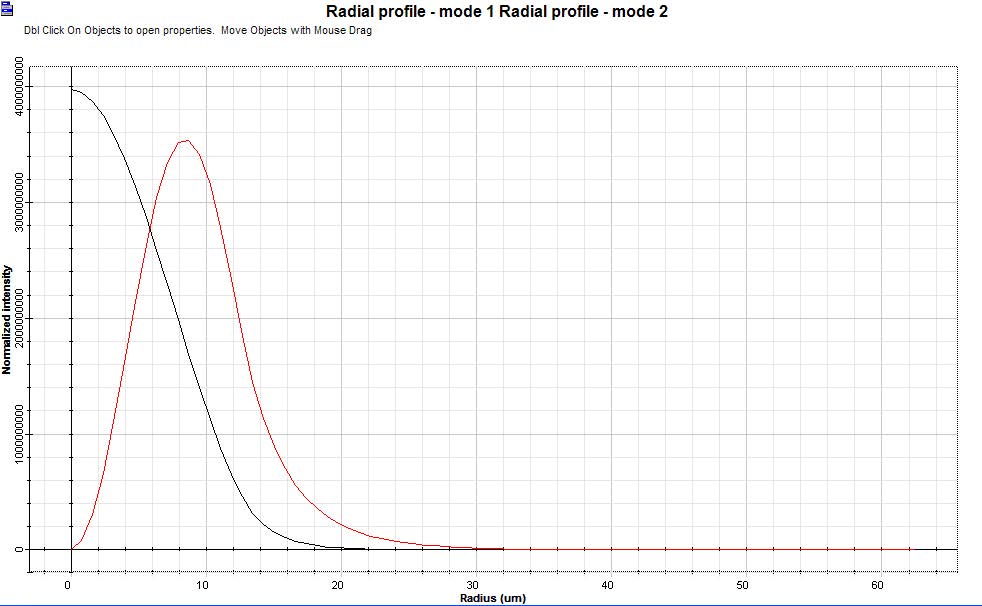
The normalized radial intensity (azimuthal angle is 0) for LP01 (black line) and LP11 (red line) are displayed in the figure.
Figure 5: Radial profiles.
The power evolution along the fiber length for LP01 (black line) and LP11 – sum of the sin and cos components – (red line) were also calculated.
Figure 6: Power evolution.
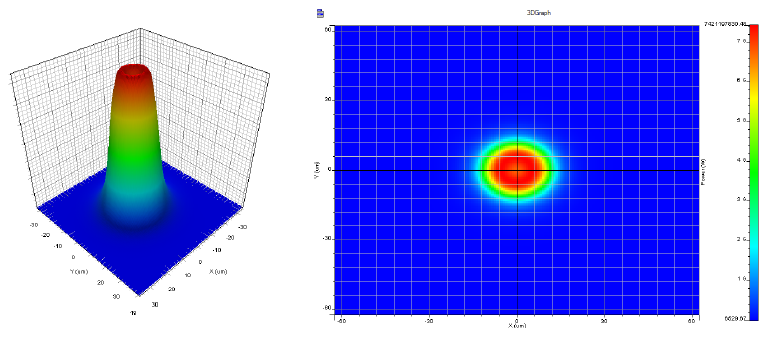
Based on the modes power distribution at the fiber output, the profile of the output beam is displayed:
Figure 7: Output beam.


