Our Analyzer provides a number of tools allowing for evaluation of different simulation
results. The Heating absorption can be evaluated only in the Observation Area.
| Step | Action |
| 1 | Open results file by analyzer. |
| 2 | In the Tools menu, select Observation Area Analysis to open the dialog box. |
| 3 | Click on the Observation Area button to open “ObservationArea2” in the observation area check list. Select wavelength 1.5 from the l/f list box |
| 4 | Click the Update Graph button, the steady state field pattern in the observation area will be updated for the user specified wavelength. |
| 5 | Click the Heating Absorption button, the “Heating Absorption” dialog appears.
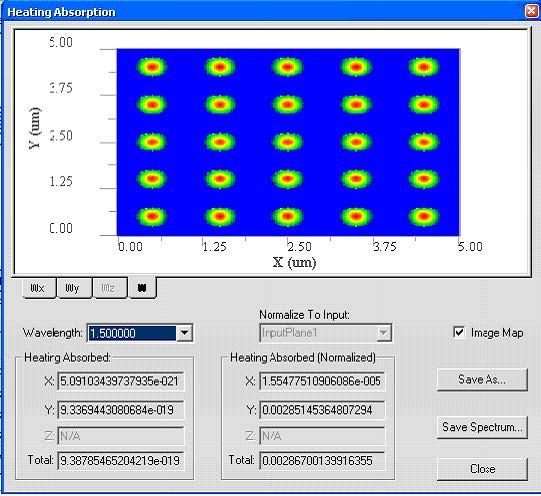
• From the wavelength list box, select the wavelength as 1.5µm • Click the Wx, Wy tab under the graph to observe the x-polarization, y- polarization heating absorption distribution. • Click W to observe the total heating absorption distribution (refer to Figure 7) |
Figure 7: Heating absorption distribution
|
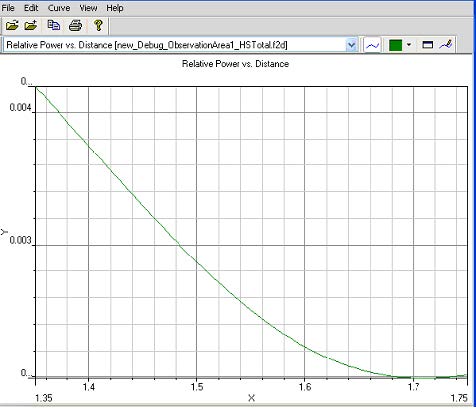
• The absorbed heating in this whole observation can be read in this dialog box. When this value normalizes to the input power for the specified wavelength, it will give the heating absorption ratio as shown the right column in the dialog box. • Equations for the heating absorption calculation can be found in the technical background • To get the normalized heating absorption spectrum for the selected heating absorption polarization, (i.e. Wx, Wy or W) Click the Save Spectrum button, and specify the filename for the output file. • Use the 2D viewer to load the exported file (refer to Figure 8) |
Figure 8: Normalized total heating absorption spectrum.
| 6 | Repeat steps 1-4 to observe the heating absorption for observation area 2 and 3. |


