
Base
| Full Name | shiva kumar |
| Organization | moulana azad national institute of technology bhopal |
| Job Title | student |
| Country |
Forum Replies Created
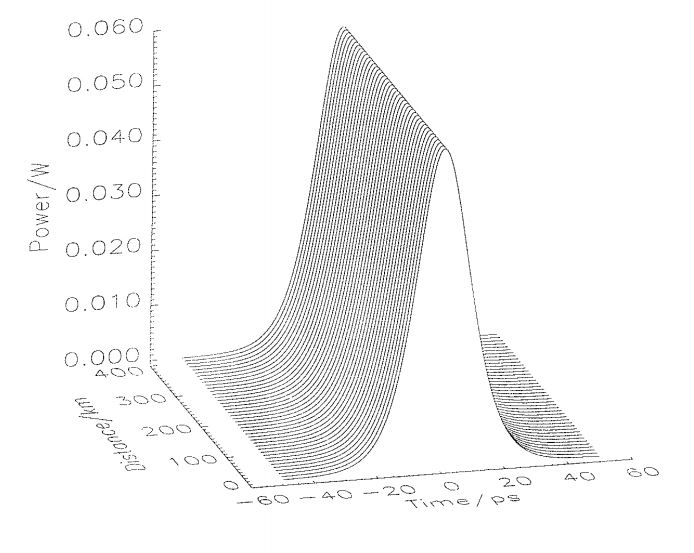
i want to plot the waveform of a soliton pulse evolution over distance vs power in optisystem. pls help. thank you
Attachments:

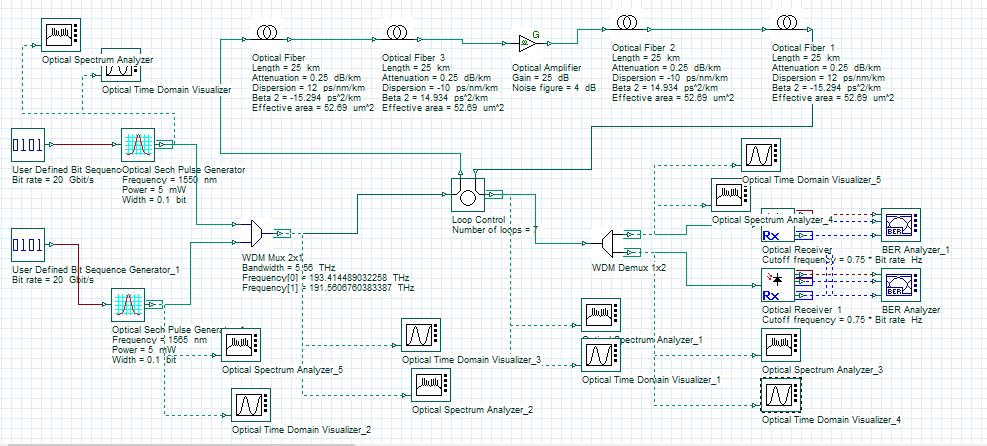
hi. I want to generate the dispersion managed soliton pulse evolution over distance vs power. I’m unable to get the waveform in optisystem. pls help
Attachments:
i’m attaching jpg snipped file
Attachments:
i’m attaching the file
it is showing that “osd file could not unloaded for security reasons”.
I’m attaching the osd file.when i placed an amplifier at 25km Q=6.66 and at 50km Q=32 and at 75km Q=170 why it is so. and i’m unable to understand how to set Beta2 values for different fibers with average beta=-0.18 and dispersion of standard fiber is -12 and dispersion of dcf is 10.And also how to optimize the transmission distance in a dispersion managed soliton system
i have been working on dispersion managed solitons. i want to plot the soliton pulse over the transmission distance vs power. pls explain the steps to plot the waveform. i’m using optisystem 14 in windows 10. i am attaching a similar kind of plot. pls explain how to plot that type of plot on optisystem
Attachments:
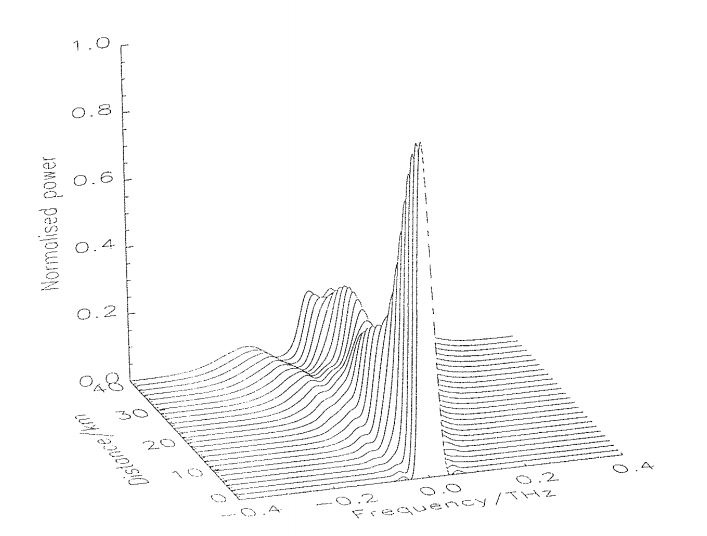
I’m using optisystem 14.0 and i have been working on dispersion managed solitons. I have been trying to generate a 3d graph between distance, dispersion and power. please explain the steps to generate such a graph in optisystem