The objective of this lesson is to characterize a semiconductor optical amplifier (SOA) through simulations.
Initially, we are going to characterize the SOA response to the variation in the input signal power.
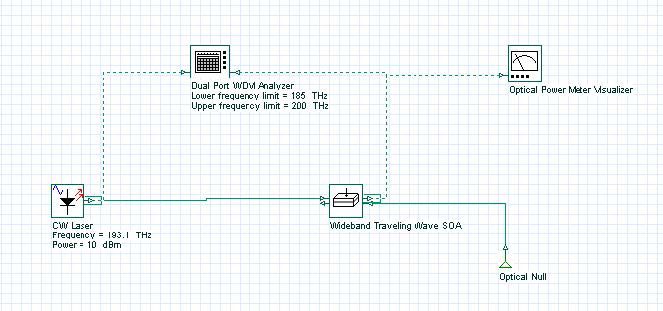
Figure 1 shows the system layout used in the simulation. We put the power parameter in the CW laser in sweep mode and it was varied from -40 dBm to 10 dBm.
Figure 1: Gain and ASE power system layout
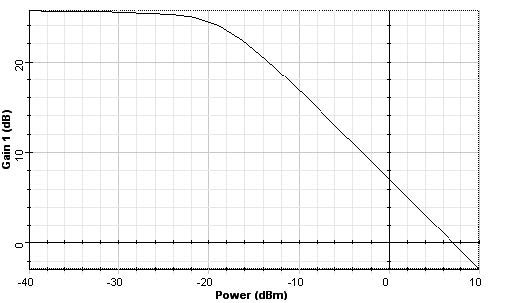
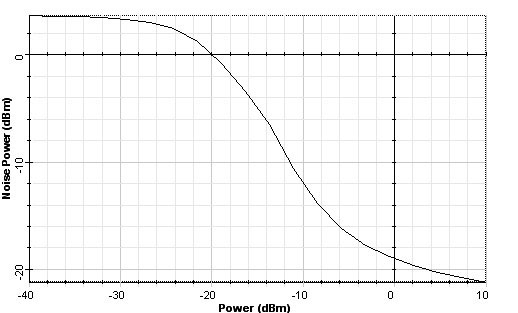
The signal gain and total forward ASE power is shown in Figure 2.
(a)
(b)
Figure 2: (a) Signal gain and (b) total ASE power at the SOA output
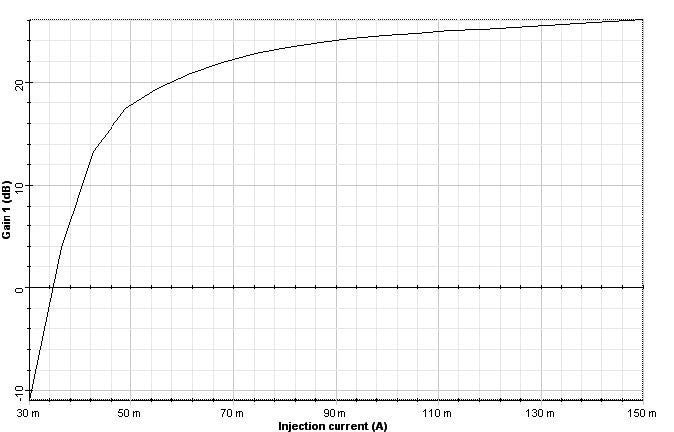
In the second part, the injection current parameter is varied from 30 mA to 150 mA. The Input signal power was kept at -30 dBm.
Figure 3 shows the signal gain results obtained in the simulation.
Figure 3: Signal gain x injection current
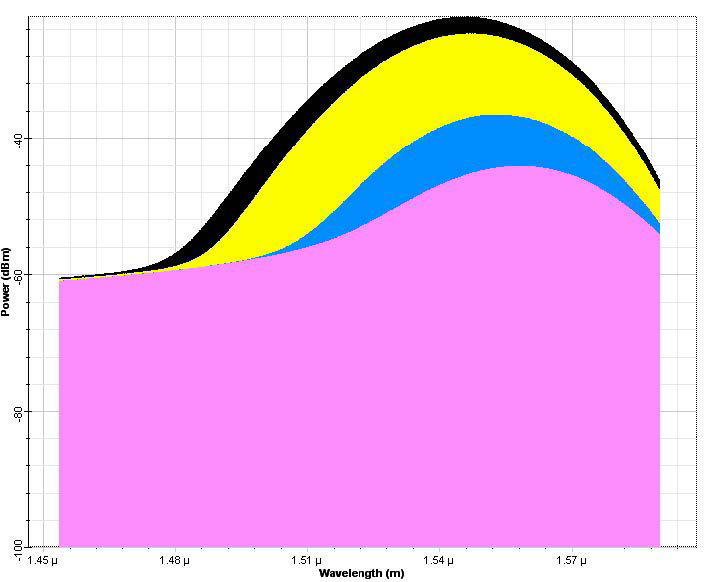
Finally, we analyze the variation the noise spectrum when the input signal power changes. In this case, the forward noise was analyzed. Figure 4 shows the spectra for 4 different input powers: -30 dBm, -20 dBm, -10 dBm and 0 dBm. We can see the increase in the noise peak power with the decrease in the input signal power.
Figure 4: Noise spectra for different input signal powers


