The purpose of this lesson is to demonstrate how to obtain the laser physical parameters from measurements.
Case 1: Setting the measured values Z, Y, P1 and Ith to obtain the correspondent physical parameters:
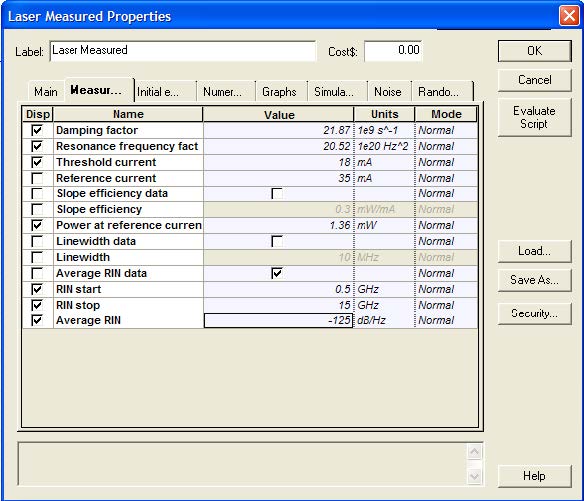
Using the measured values obtained in [1], set up the measured tab in the laser component:
P1 = 1.36 mW @ I bias = 35 mA
Ith = 18 mA
Z1 = 20.52 x 10²⁰ Hz2
Y1 = 21.87 x 10⁹ s-1
Figure 1: Measured values setup
Figure 2: Main tab parameters
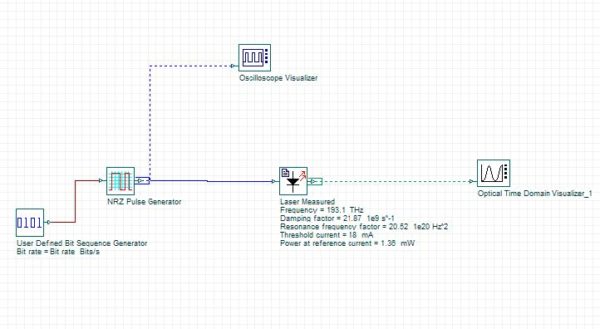
After setting up and calculating the system (See Figure 3), the results obtained from the parameter extraction are displayed in the project browser window.
Figure 3: System layout
Figure 4: Project browser
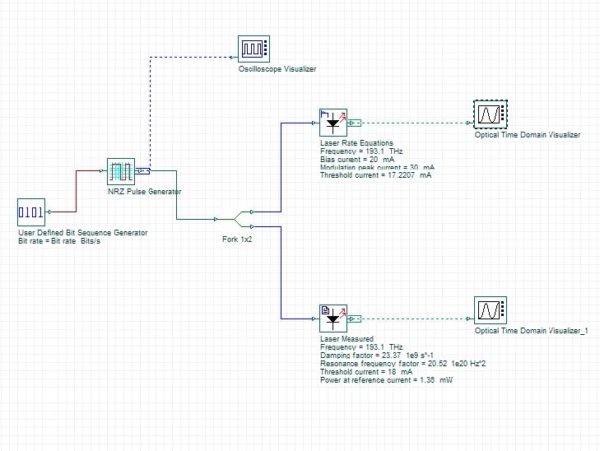
To compare these results with the ones obtained in reference [1] , a new system was designed with two laser components:
- A laser measured component similar to the one used in Figure 3
- A laser rate equations component that uses the physical parameters obtained in the reference [1].
The system layout is shown in the following figure:
Figure 5: System layout comparing results
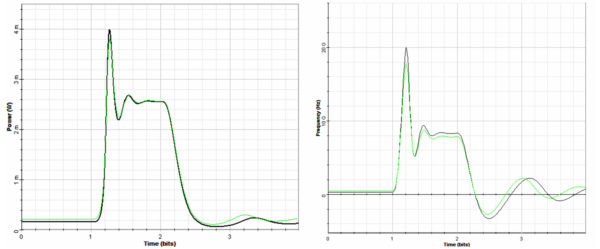
Similar results were found using both lasers (Figure 6). The differences presented were caused basically by the fact that the physical parameters obtained from [1] did not produce the same measured parameters like the ones generated at the laser measured. (e.g. the threshold current calculated in the laser rate equations indicate 17.22 mA and not 18 mA).
Figure 6: (a) Pulse intensity and (b) chirp
Case 2: Setting the measured values Z, Y, P, Ith and also setting an average RIN value to obtain the correspondent physical parameters
In this case the measured values are the same as presented in the previous case. However, the average RIN and bandwidth, in which the average RIN is calculated, was added to the list of values.
Figure 7: Measured values setup
To visualize the results generated from the laser parameters, the following system was designed:
Figure 8: System layout
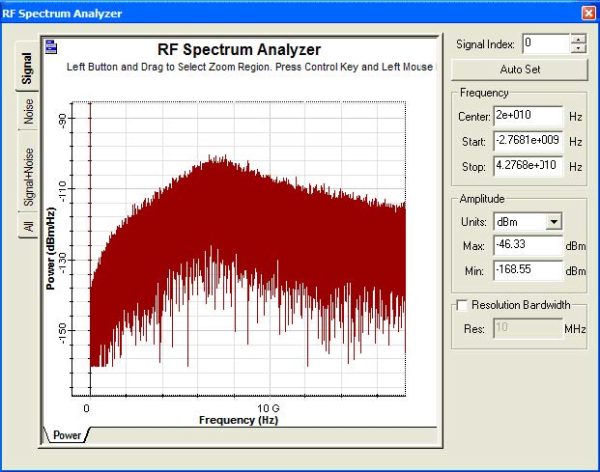
After running the system, the output power measured in the Electrical power meter is -27.3 dBm. To visualize the RIN in the RF spectrum analyzer, we have to go to the visualizer properties and set its parameters to calculate the spectral density and take into consideration the signal power.
Figure 9: Setting the RF spectrum analyzer to calculate the spectral power density using the scale factor of 27.3 dB
After these changes the RIN can be visualized in the RF spectrum analyzer:
Figure 10: RIN spectra
This component can help the user to reproduce a laser behavior, however sometimes the parameter extraction procedure can not converge depending on the initial parameter estimation or the use of values (e.g. unrealistic RIN) that can not be reproduced by the laser.
References:
[1]Cartledge, J. C. and Srinivasan, R. C. “Extraction of DFB laser rate equation parameters for system simulation purposes”, J. Light. Techn., 15, 852-860, (1997).


