One of the main features of OptiSystem is the mixed signal representation.
Individual sample is a signal type that allows the users to simulate time-driven systems in the electrical and optical domain. By using time-driven simulation, users can create designs that have closed loops and feedbacks.
Additionally, the optical individual sample allow for simulation of WDM systems by using multiple bands. Each band shares the same sample rate and time window, but they can have different center frequencies.
To manipulate individual samples, there are four new components available in the component library:
| Component name | Folder | Icon |
| Convert To Electrical Individual Samples |
Signal Processing Library/Tools/Electrical/ | |
| Convert From Electrical Individual Samples |
Signal Processing Library/Tools/ Electrical/ | |
| Convert To Optical Individual Samples |
Signal Processing Library/Tools/Optical/ | |
| Convert From Optical Individual Samples |
Signal Processing Library/Tools/Optical/ |
To verify if a component is compatible with individual samples, you should check OptiSystem component library documentation.
A Time-Driven Simulation
Global parameters
To reduce the calculation time, we should reduce the number of samples of the signals that will be calculated during the simulation.
To reduce the number of samples, we can reduce the sequence length and the number of samples per bit.
- In the global parameters dialog box, change the parameter Sequence length to 16, and the Samples per bit to 32. The Number of samples parameter should be 512 (Figure 1).
Figure 1: Global parameters
This means that we will have 512 individual samples at the output of the Convert To Electrical Individual Samples component, and 512 individual samples per WDM channel at the output of the Convert To Optical Individual Samples component.
System setup
We can start adding the components to design the basic time-driven system.
From the component library, drag and drop the following component in to the layout:
- From “Default/Transmitters Library/Optical Sources”, drag and drop the “CW Laser” into the layout.
- From “Default/Transmitters Library/Bit Sequence Generators”, drag and drop the “Pseudo-Random Bit Sequence Generator” into the layout.
- From “Default/Transmitters Library/Pulse Generators/Electrical”, drag and drop the “NRZ Pulse Generator” into the layout.
- From “Default/Visualizers Library/Optical”, drag and drop the “Optical Time Domain Visualizer” into the layout.
- From “Default/Visualizers Library/Electrical”, drag and drop the “Oscilloscope Visualizer” into the layout.
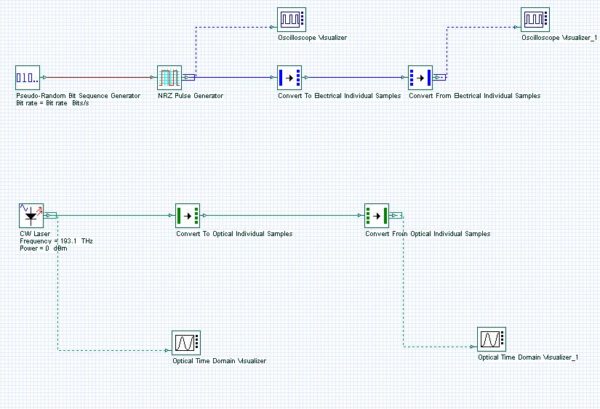
The next step is to connect the components according to the Figure 2.
Figure 2: First layout
Running the simulation
We can run this simulation and analyze the results:
- To run the simulation, you can go to the File menu and select Calculate. You can also press Control+F5 or use the calculate button in the toolbar. After you select Calculate, the calculation dialog box should appear.
- In the calculation dialog box, press the Play button.
Viewing the results
To see the results, double click at each of the time domain visualizers. The optical and electrical signals are available in Figure 3.
These are the graphs of the sampled signals. To convert these signals into individual samples, we can use the components from Table 1.
Figure 3: CW Laser output and NRZ pulse generator output
System setup – Individual Samples
- Drag and drop the components from Table 1 into the layout.
- Duplicate the time domain visualizers
- Connect the components according to the Figure 4.
- Run the simulation
Figure 4: Layout using the individual sample tools
Viewing the results
To see the results, double click at each of the time domain visualizers.
The optical and electrical signals are available in the Figure 5. You will notice that the signals are the same as in Figure 3.
The CW laser will send a sample signal to the ‘Convert to…’ component. This component will generate 512 samples and send each one of them to the ‘Convert from…’ component. The 512 samples will be combined into a signal that should be the same as the original signal from the laser. The same process applies to the electrical signal.
Figure 5: ‘Convert from…’ components outputs
Important remarks
- Visualizers cannot display individual samples. You should use a ‘Convert From…’ component before a visualizer.
- Check if a component is compatible with individual samples before creating a project.
- The project scope that requires simulation using individual samples must be confined between the ‘Convert To…’ and ‘Convert From…’ components.
- For each individual sample a component will run one calculation. This means the simulation will be slower when using individual samples.
- Faster simulation can be obtained by disabling calculation scheduler messages.
Filtering using individual samples
There are two type of filtering techniques used in OptiSystem when working with individual samples.
If a filter has the parameters Digital filter and Digital filter order available, the user can enable the FIR filter and enter the number of coefficients for the filter.
Be aware of the FIR filter latency because the filter will introduce a delay equal to one half of the number of coefficients.
If the filter does not have these parameters or if the ‘Digital filter’ parameter is disabled, the individual samples will be attenuated by the value at the filter center frequency.
In this case, we are assuming that the filter bandwidth is much wider than the sample rate. For optical signals, there attenuation will be wavelength dependent.
This means that every individual sample will have a different value of attenuation depending on the filter shape.
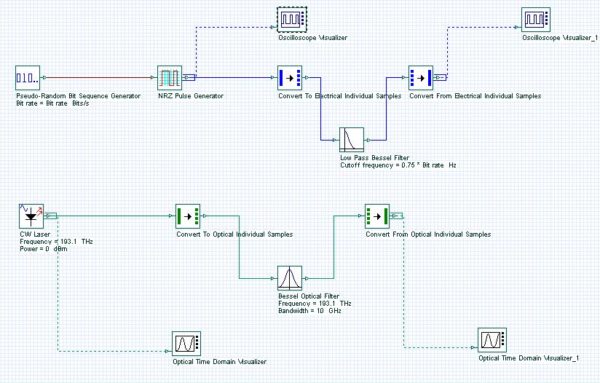
- From “Default/Filters Library/Electrical”, drag and drop the “Low Pass Bessel Filter” into the layout.
- From “Default/Filters Library/Optical”, drag and drop the “Bessel Optical Filter” into the layout.
- For both components, enable the parameter Digital filter.
- Connect the components according to the Figure 6.
- Run the simulation.
Figure 6: Filtering individual samples
Viewing the results
Compare the signals from the two Oscilloscopes (Figure 7). You will see that the second signal is delayed and filtered. This is related to the FIR filter used in the low pass filter. The same applies to the optical signal.
Figure 7: Electrical signal before and after FIR filter


