This lesson will prove that we can achieve high gain with a short device length if we use a high-concentration Er3+/Yb3+ codoped glass waveguide amplifier.
In this example, we simulate a codoped waveguide amplifier and show that the efficient Yb3+ to Er3+ energy transfer is a useful mechanism to reduce performance degradation due to Er3+ ion-ion interactions [1].
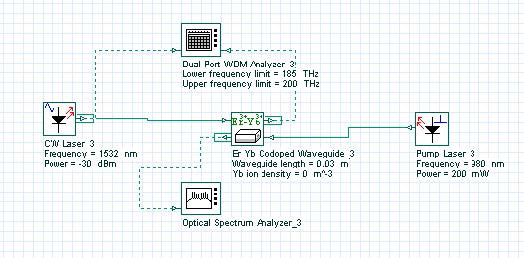
The project consists of different layouts that work together in order to generate the different graphs that we need. All these layouts have the form shown in Figure 1.
Figure 1: Project Layout for analysis of the Waveguide Amplifier component
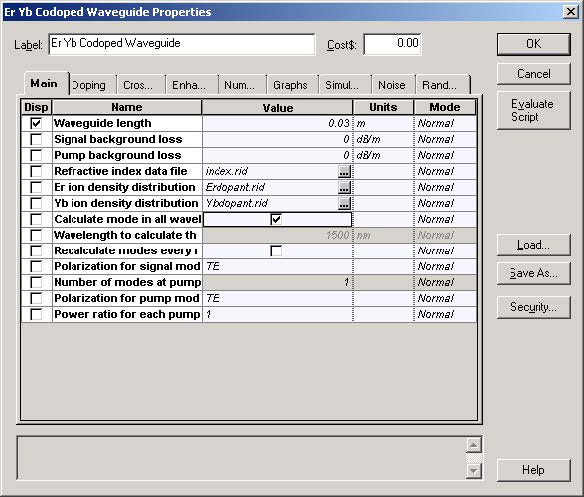
The basic parameters for the waveguide amplifier component, extracted from [1], do not change, so for all layouts we will have the following common parameters (as displayed in Figure 2), not including the waveguide length.
Figure 2: Waveguide amplifier parameters
The refractive index file was defined using OptiBPM 6.0, and defines a channel that
has a narrow square core 2 x 2μm2 , and a refractive-index difference of
0.04 (ηco = 1.55, ηcl = 1.51). These parameters have been chosen in order to
ensure single-mode operation at pump and signal wavelengths (980 and 1532 nm,
respectively), polarization independent signal gain, and at the same time, to have a
good field confinement on the active region [1]. ASE definition, as described in
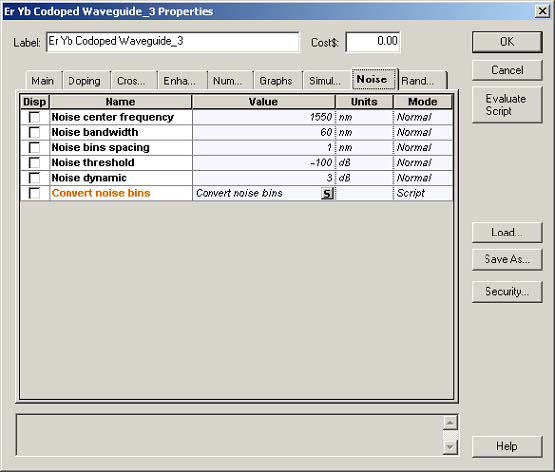
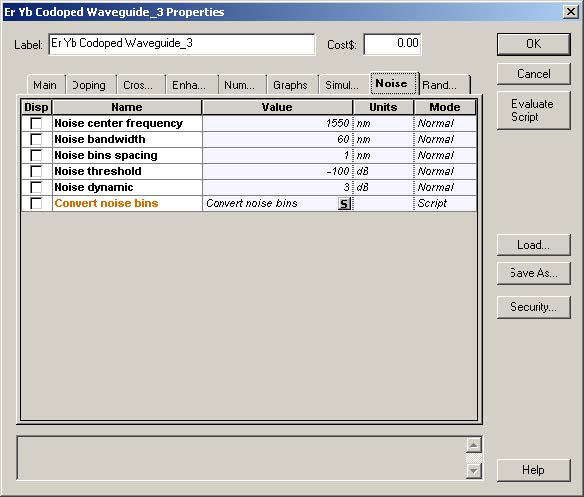
Figure 3, is kept the same through all the different layouts.
Figure 3: Description of ASE
The layouts “EDWA x Er concentration”, “EDWA (Cup = Ccr = 0 ) x Er
concentration”, “EYCDWA x Er concentration (Yb concentration = 1.0 x 1027)”,
“EYCDWA x Er concentration (Yb concentration = 2.0 x 1027)” and “EYCDWA x Er
concentration (Yb concentration = 5.0 x 1026)” are intended to produce a valuable
comparison among these different amplifiers. The values used in the Doping tab are
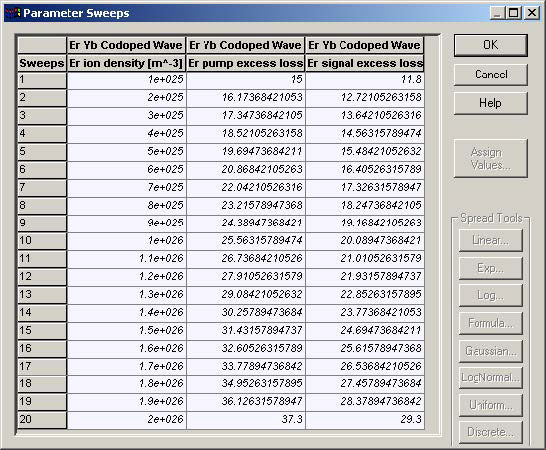
displayed in Figure 4.
Figure 4: Erbium data
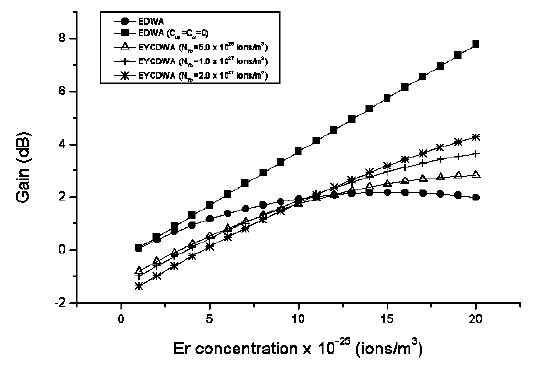
Using the erbium ion density, erbium signal loss, and erbium pump loss as shown above; we perform simulations for an amplifier of 3 cm pumped at 980 nm and different ytterbium concentrations in the case of EYCDWA (Figure 5). By these simulations, it is clear that increasing the Ytterbium concentration, Yb3+ to Er3+ energy transfer progressively reduces the negative effect due to Er3+ ion-ion interactions only at high-erbium concentrations.
Figure 5: Signal gain versus erbium concentration (Pp=200mW, Ps=1μ W, L=3cm)
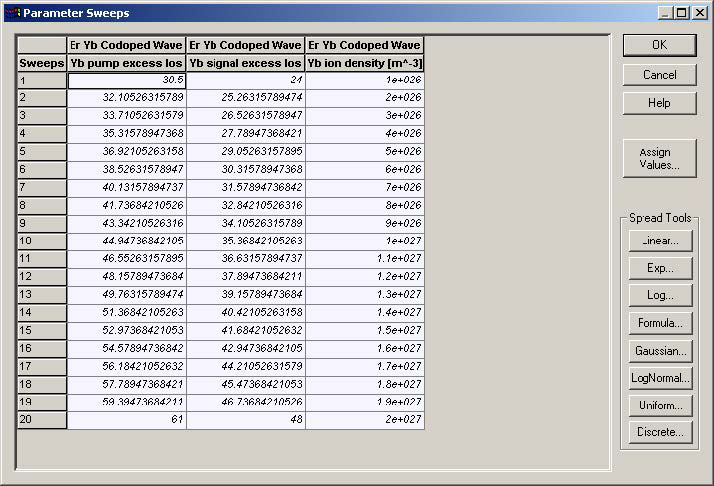
For the layouts “Yb concentration (3 cm)”, “Yb concentration (4 cm)” and “Yb concentration (5 cm)”, the doping values change (see Figure 6).
Figure 6: Ytterbium data
For the Ytterbium concentration defined above, an EYCDWA pumped at 980 nm, with a fixed-erbium doping level, has the profile defined in Figure 7. This graph shows that higher gain can be reached by increasing the Ytterbium concentration. Nevertheless, by increasing the waveguide length, there is an optimum Ytterbium concentration above which the gain is reduced.
Figure 7: Signal gain versus Ytterbium concentration (Pp=200mW, Ps=1 W, L=3cm, NEr=2.0 1026 ions/m3)
As we see a quantitatively good agreement with the paper considered is observed. Furthermore, we showed that OptiSystem is suitable to support the development of EYCDWA, a very promising area for optical signal processing techniques.
References
[1] F. Di Pasquale and M. Federighi, “Improved Gain Characteristics in High-Concentration Er3+/Yb3+ Codoped Glass Waveguide Amplifiers”, IEEE Journal of Quantum Electronics, vol. 30, no. 9, September 1994, 2127-2131.


