When the simulation ends, a message appears and prompts you to open OptiFDTD_Analyzer (see Figure 23).
Figure 23: Message box
| Step | Action |
| 1 | To open OptiFDTD_Analyzer and view the simulated results, click Yes.
Note: When the simulation ends, the results are saved automatically as a file with same name but a different file extension (*.fda). |
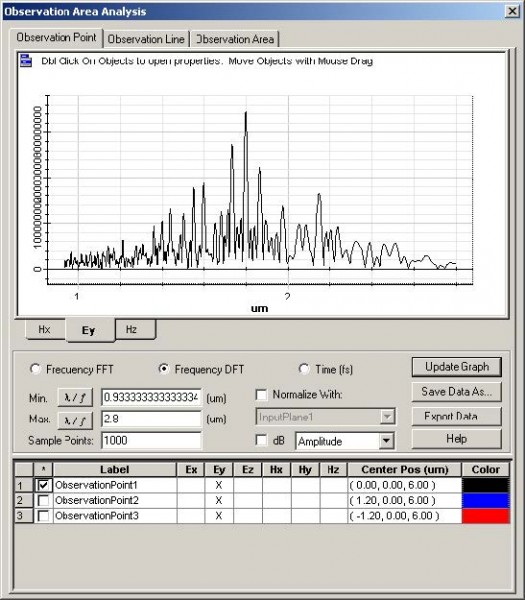
| 2 | Select Tools > Observation Area Analysis.
The Observation Area Analysis dialog box appears. |
| 3 | On the Observation Point tab, type/select the following:
Observation Point1 Frequency DFT Min. λ /f : 0.9μm Max. λ /f : 2.8μm Sample Point: 1000 |
| 4 | Click Update Graph to view updated results.
The spectral response in Observation Point1 are displayed, and the four wave mixing effect can be seen in the curve (see Figure 24). |
Figure 24: OptiFDTD_Analyzer—Observation point results analysis


