
This lesson demonstrates the transient effects in an EDFA caused by the addition or deletion of channels using the EDFA Dynamic models of the OptiSystem.
The performance of a WDM system can be critically affected by the adding-dropping of WDM channels since all channels present are amplified simultaneously by each amplifier and share the available saturated gain. The add-drop of the channels causes transient effects in the surviving channels.
In the first part on this lesson, the transient effects are analyzed using the EDF Dynamic component. The system simulated is shown in Figure 1. The simulations analyze the power transients caused by adding channels to the system.
The signal at 1536 nm represents the surviving channel and has the input power correspondent to a certain number of channels. The signal at 1552 represents the add-channel and has the input power correspondent to the number of channels to be added in the system.
It is assumed that the sum of the input powers of the channels is -2 dBm, which would correspond to 32 channels with input power of -17 dBm each. The CW signal of the add channel is modulated to represent an addition of channels at the time of 2 ms.

Figure 1: System layout
The main parameters of the EDF are displayed in Figure 1. The cross sections used in the simulations are similar to the aluminogermano silicate fiber (fiber type III) shown in Fig. 4.22 of Desurvire’s book [1].


Figure 2: Absorption and Emission cross sections
The different power proportions for the modulated add-channel and the surviving channel approximate different combinations in adding channels. The system in Figure 1 analyzes the addition of 4, 8, 12, 16, 20, 24 and 28 channels. The input power distribution for the channels is shown in Table 2.
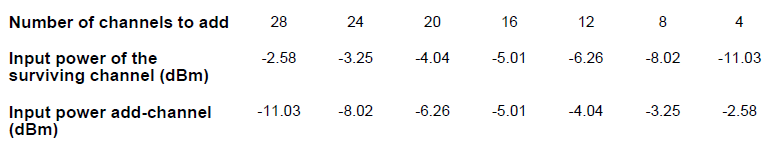
Table 2: Input power distribution
The results found in the simulations are shown in Figure 3.

Figure 3: Evolution of the power excursion of the channel at 1536nm for adds 4, 8, 12, 16, 20, 24 and 28 channels
As expected, the increment of the number of channels in the system caused power transients in the output of the surviving signal. The amplitude of the power excursion is proportional to the number of channels added. After some time, the system reached the steady state again, but in a lower output power.
In the following section, the transients are analyzed with the EDF dynamic analytical component. The system used in the simulations is shown in Figure 4. In this case, the add-drop of channels was investigated. The different power proportions for the modulated channel at 1557.2 nm and the surviving channel approximate different combinations in the number of dropped and surviving channels. It was assumed that the total power of the two channels corresponds to 8 channels, each of which launched -14.7 dBm of output power in the EDF.

Figure 4: System layout
The main parameters of the EDF are displayed in Figure 4, and the absorption and emission cross-sections are shown in Figure 5.
 Absorption and (b) emission cross section")
 Absorption and (b) emission cross section")
Figure 5: a) Absorption and (b) emission cross section
The channels were dropped and added at 2 ms and 6 ms, respectively. Figure 6 shows the results for different values of the proportion of surviving channel power to the total power (which is kept constant). The results of the addition of channels shown in Figure 6 agrees with Figure 3. The drop of channels in the system tends to cause an increase in the output power of the surviving channels.

Figure 6: Evolution of the power excursion of the survival wavelength at 1554nm for 7 different values of the surviving wavelength power as a proportion of the total input power
In a second example, the effect of different pump powers in power excursion was analyzed. In this case the input power in the surviving channel (1554 nm) and the modulated channel (1557.2 nm) was the same: -8.67 dBm. The power excursions were examined for 4 pump powers: 10.3 dBm, 12.5 dBm, 13.9 dBm, and 15.1 dBm. The results found are shown in Figure 7.

Figure 7: Power excursion of the surviving wavelength at 1554 nm for four different pump powers values
For increasing pump power values the evolution of the power transient begins from higher inversion/gain levels and settles to higher gain levels with an increasing in the ASE causing a decreasing in the power excursions.
The results presented here are in very good agreement with studies in the references.
References:
[1]Emmanuel Desurvire. “Erbium-Doped Fiber Amplifier: Principles and Applications”, John Wiley & Sons.
[2]C. Dimopoulos. “Study of Dynamic Phenomena in WDM Optical Fiber Links and Networks Based on EDFA”. PHD thesis. University of Essex, April 2001