This lesson describes how to simulate a WDM system with 8 channels. You will become familiar with the Component Library, parameter groups, and visualizers such as the BER Analyzer.
Global parameters
For this simulation we will use default parameters for the Bit rate, Bit sequence length, and Sample rate.
Viewing the global parameters
To view the default global parameters, perform the following procedure.
| Step | Action |
| 1 | From the File menu, select New. A blank Main layout appears in the Project layout window. |
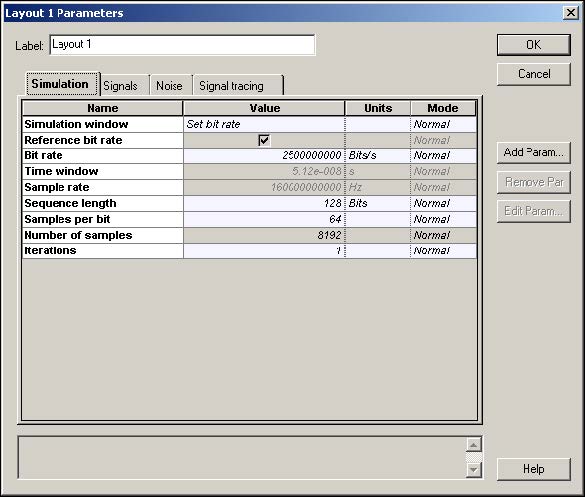
| 2 | Double-click anywhere in the Main layout. The Layout 1 Parameters dialog box appears (see Figure 1). The default global parameters used for this simulation are:•Bit rate: 2500000000 Bits/s •Sequence length: 128 bits |
Figure 1: Global parameters
Transmitters
To create the transmitters for the WDM system with 8 channels, perform the following procedure.
| Step | Action |
| Note: To increase the size of the layout, press Ctrl+Shift and drag the cursor from the top left corner of the Main layout to the bottom right corner. | |
| 1 | Create an external modulated laser using the procedures in Lesson 1: Transmitter — External modulated laser. |
| 2 | Select the four external modulated laser components. |
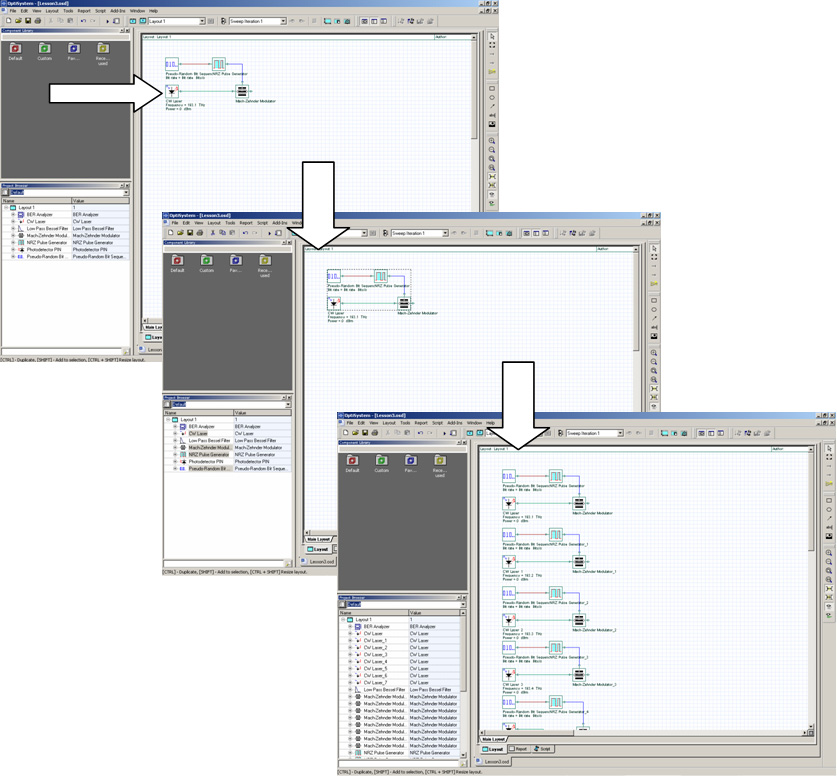
| 3 | Copy and paste the selected components to create a total of eight transmitters (see Figure 2). |
Figure 2: Creating eight external modulated lasers
| 4 | From the Component Library, select Default > WDM Multiplexers Library > Multiplexers. |
| 5 | Drag the WDM Mux 8×1 to the Main layout. |
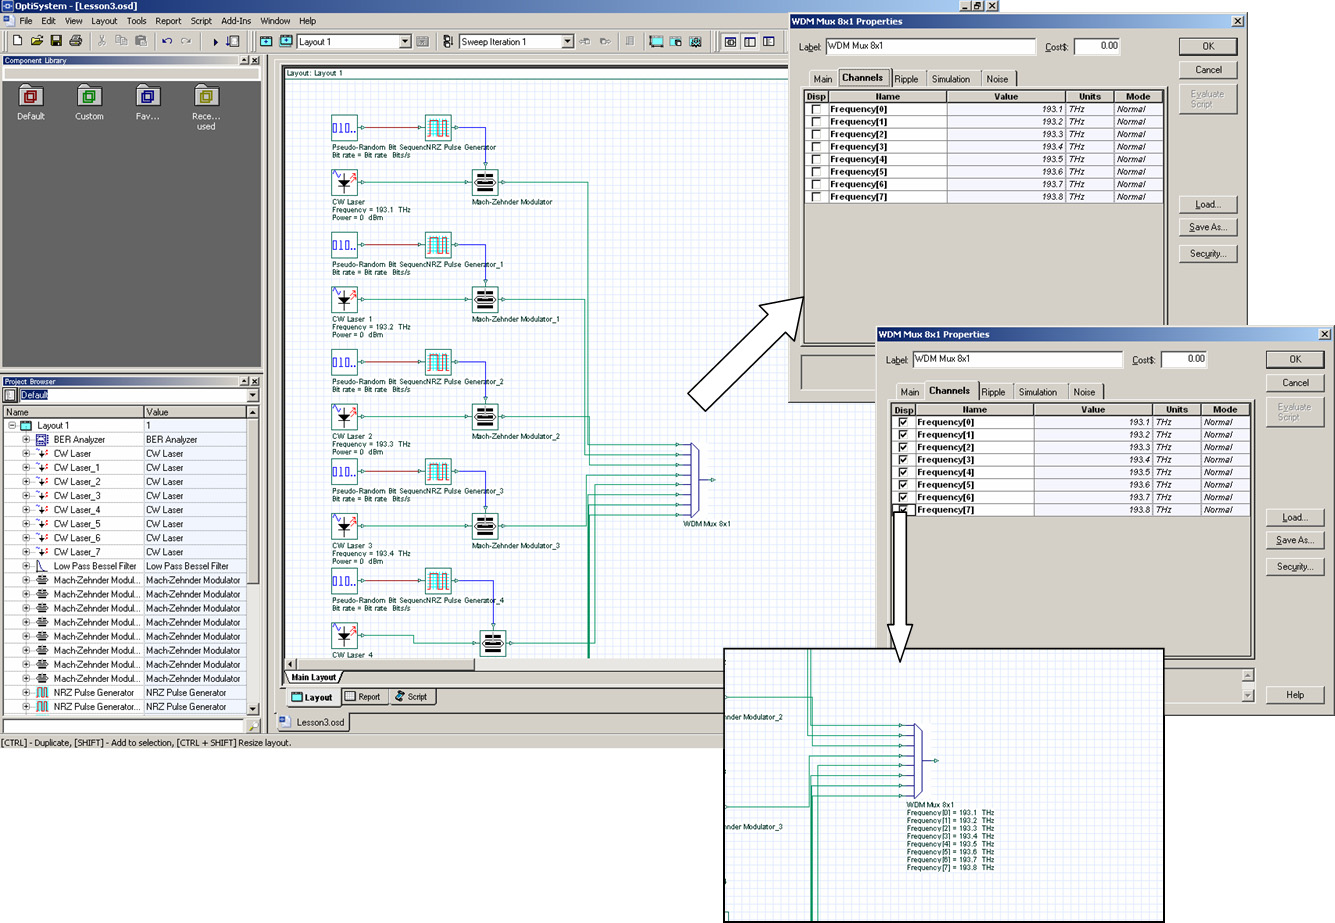
| 6 | Connect the Mach-Zehnder Modulator outputs to the WDM Mux 8×1 inputs. Note: You can select the values for the Mux internal filters to be displayed in the layout by selecting the Disp option in the Channels tab of the Mux properties dialog box (see Figure 3). |
Figure 3: Displaying multiplexer frequency channels
Parameter groups
To enter the frequency values for each channel, double-click each CW Laser and enter the frequency value. To simplify the process of entering parameter values for each component, use the Parameter groups feature.
Accessing the Parameter groups table
The Parameter groups table gives you access to relevant parameters for the WDM simulation (such as Frequency and Power) in one place. You can go into each component and enter the values to change the parameters.
To access a parameter group, perform the following procedure.
| Step | Action |
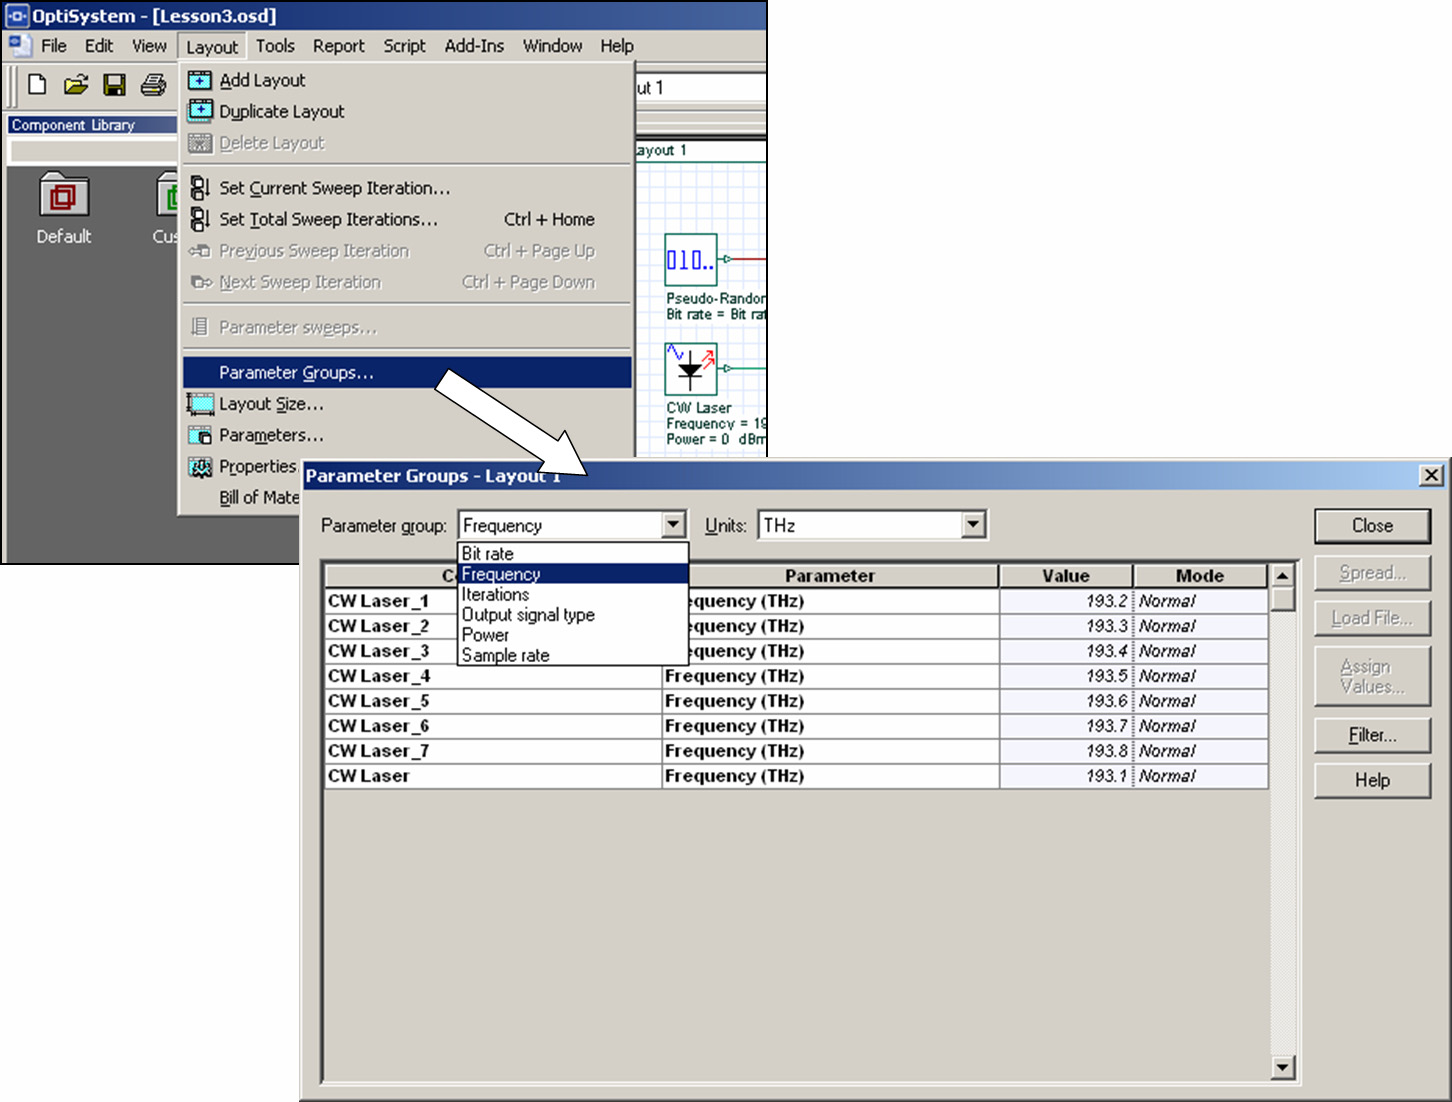
| 1 | From the Main toolbar, select Layout > Parameter groups. The Parameter Groups dialog box appears (see Figure 4). Note: Typically you can access the following parameters from the Parameter Groups table (see Figure 4): • Bit rate • Convert noise bins • Frequency • Iterations • Output signal type • Power • Sample rate You can also enter the units for the parameter group and edit the parameter values by typing new values or using the tools from the context menu. |
Figure 4: Parameter groups
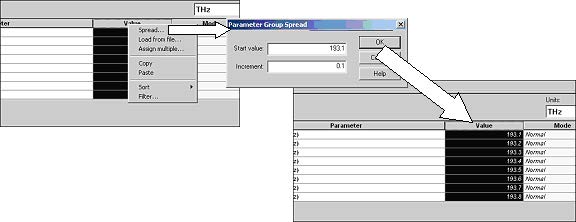
| 2 | Click the Value column. The Value column is highlighted. |
| 3 | In the Parameters Groups table, select the Value column and right-click. A context menu appears. |
| 4 | Select Spread. The Parameter Group Spread dialog box appears (see Figure 5). |
| 5 | In the Start Value text box, type: 193.1 |
| 6 | In the Increment text box, type: 0.1 |
| 7 | To return to the Main layout, click Close. The frequencies in the Value column are updated from 193.1 THz to 193.8 THz (see Figure 5). |
Figure 5: Entering frequency values
Testing the transmitter
To verify the system setting for this design, use an Optical Spectrum Analyzer and a WDM analyzer to obtain the signal spectrum and the total power for each channel.
To test the transmitter, perform the following procedure.
| Step | Action |
| 1 | From the Component Library, select Default > Visualizer Library > Optical. |
| 2 | Drag the Optical Spectrum Analyzer to the Main layout. |
| 3 | Drag the WDM Analyzer to the Main layout. |
| 4 | Connect the Optical Spectrum Analyzer input and the WDM Analyzer input to the WDM Mux output. |
| 5 | Run the simulation: a. Click Calculate. The Calculation dialog box appears. b. Click the Run button. The calculation progress appears in the Calculation dialog box. |
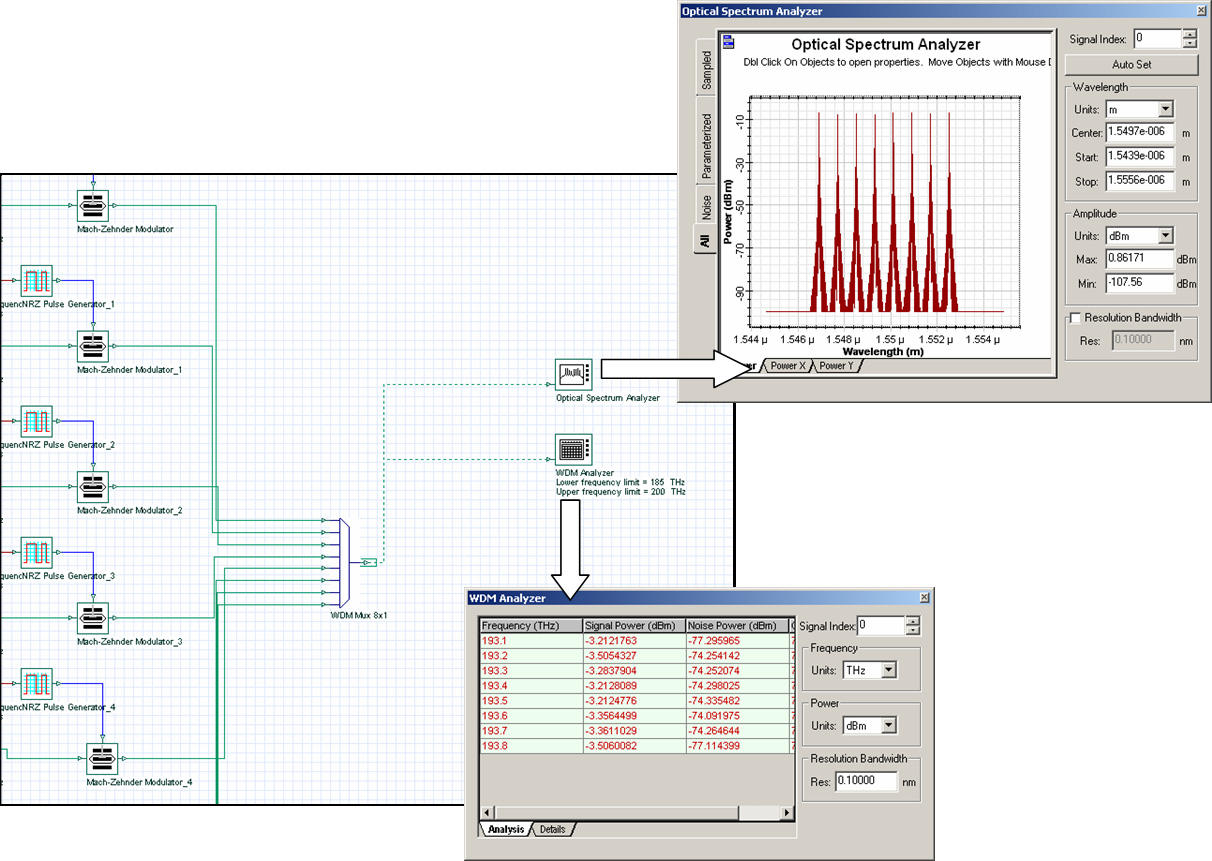
| 6 | Double-click Optical Spectrum Analyzer to view the graph (see Figure 6). The graph appears and displays eight equally-spaced channels. |
| 7 | Double-click the WDM Analyzer to view the numerical results (see Figure 6). The WDM Analyzer dialog box appears and displays the numerical results for the eight channels. Note: The average signal power for each channel is approximately -3.3 dBm for a resolution bandwidth of 0.1 nm. |
Figure 6: Simulation results from the visualizers
Fiber + EDFA spans
To create a fiber connected to an EDFA, perform the following procedure.
| Step | Action |
| 1 | From the Component Library, select Default > Optical Fibers Library. |
| 2 | Drag the Optical Fiber to the Main layout. |
| 3 | Double-click the Optical Fiber. The Optical Fiber Properties dialog box appears. |
| 4 | To change the parameter length to 80 km, click the Value cell beside Length, and type: 80 |
| 5 | To return to the Main layout, click OK. |
| 6 | From the Component Library, select Default > Amplifiers Library > Optical. |
| 7 | Drag the Optical Amplifier to the Main layout. |
| 8 | In the EDFA Parameters, change Operation Mode to Power Control. |
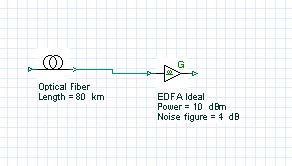
| 9 | Connect the Optical Fiber output to the EDFA Ideal input (see Figure 7). |
Figure 7: Fiber + EDFA span
Connecting the Loop Control
The Loop Control allows you to set the number of times the signal propagates in the components that are connected between the Loop Control input and output ports. Use the Loop Control to calculate the system performance based on the number of fibers and EDFA spans.
To connect the Loop Control, perform the following procedure.
| Step | Action |
| 1 | From the Component Library, select Default > Tools Library. |
| 2 | Drag the Loop Control to the Main layout. |
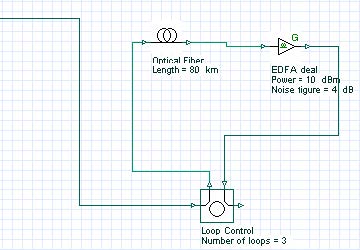
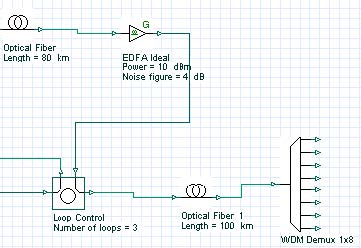
| 3 | Connect the output port of the WDM Mux 8×1 to the first Loop Control input port. |
| 4 | Connect the first Loop Control output port to the Optical Fiber input port (see Figure 8). |
| 5 | Connect the output port of the second EDFA Ideal (connected to the Optical Fiber) to the Loop Control input port (see Figure 8). |
Figure 8: Loop control
Setting the number of signal round trips
You define the number of round trips that the signal makes through the loop by setting the Number of loops parameter in the Loop Control.
To set the number of signal round trips, perform the following procedure.
| Step | Action |
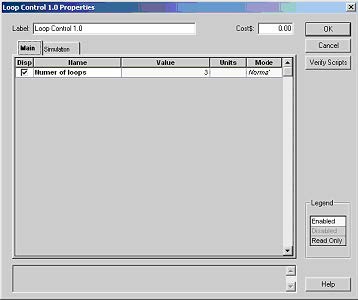
| 1 | Double-click the Loop Control. The Loop Control Properties dialog box appears (see Figure 9). |
Figure 9: Loop control parameters
| 2 | To set the number of signal round trips, click the Value cell beside number of loops, highlight the 0, and type: 3 Note: The signal will propagate 3 x 80km = 240 km. |
| 3 | To return to the Main layout, click OK. |
| 4 | From the Component Library, select Default > Optical Fibers Library. |
| 5 | Drag the Optical Fiber to the Main layout. |
| 6 | Set the fiber Length to 100km. |
| 7 | From the Component Library, select Default > WDM Multiplexers Library > Demultiplexers. |
| 8 | Drag the WDM Demux 1×8 to the Main layout. |
| 9 | Connect the second Loop Control output port to the Optical Fiber and then to the WDM Demux 1×8 input port (see Figure 10). |
| 10 | To view the WDM Demux 1×8 frequencies: a. Double-click the WDM Demux 1×8 The WDM Demux 1×8 Properties dialog box appears.b. Select the Channels tab.c. In the Disp column, select the check box beside each frequency.d. To return to the Main layout, click OK. The eight frequencies and their values appear below the WDM Demux 1×8 (see Figure 10). |
Figure 10: Demultiplexer
Obtaining results after the demultiplexer
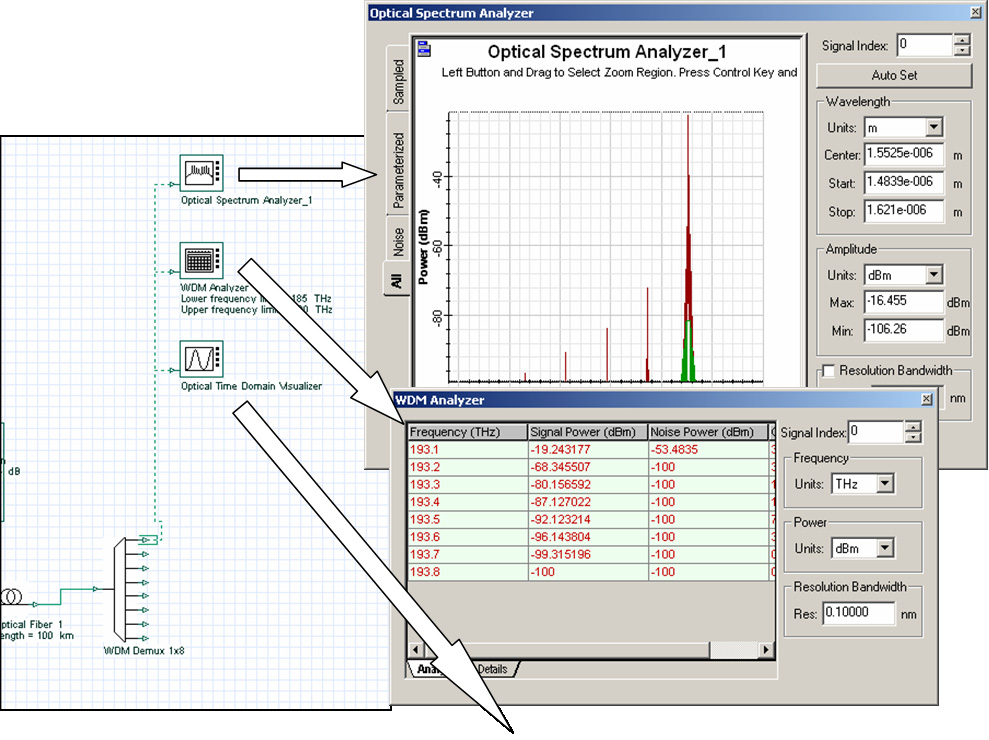
To verify the system setting for this design, you will use an Optical Spectrum Analyzer, a WDM Analyzer, and an Optical Time Domain Visualizer.
To obtain the signal results in time and frequency and the total power for each channel after the signal passes through the WDM Demux 1×8, perform the following procedure.
| Step | Action |
| 1 | From the Component Library, select Default > Visualizer Library > Optical. |
| 2 | Drag the Optical Time Domain Visualizer to the Main layout. |
| 3 | Drag the Optical Spectrum Analyzer to the Main layout. |
| 4 | Drag the WDM Analyzer to the Main layout. |
| 5 | Connect each of the visualizers to the first output port on the WDM Demux 1×8 (193.1 THz). |
| 6 | Run the simulation:
a. Click Calculate. b. Click the Run button. Note: This simulation will take some time. |
| 7 | Double-click the visualizers to view the results and graphs (see Figure 11). |
Figure 11: Simulation results from the visualizers
Adding a receiver
To add a photodetector, an electrical amplifier, and a Bessel filter to the design, perform the following procedure.
| Step | Action |
| 1 | From the Component Library, select Default > Receivers Library > Photodetectors. |
| 2 | Drag the Photodetector PIN to the Main layout. |
| 3 | Set the Thermal Noise parameter to 10-21. |
| 4 | From the Component Library, select Default > Filters Library > Electrical. |
| 5 | Drag the Low Pass Bessel Filter to the Main layout. |
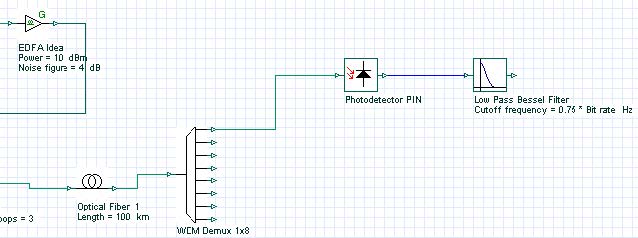
| 6 | Connect the first output port on the WDM Demux 1×8 to the Photodetector PIN input port. |
| 7 | Connect the Photodetector PIN output port to the Low Pass Bessel Filter input port (see Figure 12). |
Figure 12: Adding the receiver to the WDM system
Note: This design could be made using the WDM Transmitter component from the Optical Transmitters library. Fewer steps are required if you use this component. When using the WDM Transmitter, the receiver will require the 3R Regenerator component from the Receivers library (see sample file Lesson3B.osd).
Figure 13: WDM Transmitter layout design (Lesson 3B.osd)
BER Analyzer
The BER Analyzer calculates system performance. It can predict the BER, Q-factor, threshold, and Eye aperture of a system. You can view the BER patterns and the BER value in each point of the Eye diagram using 3D graphs.
Adding the BER Analyzer
To add the BER Analyzer to the system, perform the following procedure.
| Step | Action |
| 1 | From the Component Library, select Default > Visualizer Library > Electrical. |
| 2 | Drag the BER Analyzer to the Main layout. Note: The first BER Analyzer input port receives the binary signal. |
| 3 | Connect the output port of the first Pseudo-Random Bit Sequence Generator to the first BER Analyzer input port. Note: The second BER Analyzer input port receives the original sampled signal. It compensates the delay between the signals that are transmitted and received. |
| 4 | Connect the output of the first NRZ Pulse Generator to the second BER Analyzer input port. |
| 5 | Connect the Low Pass Bessel Filter output port to third BER Analyzer input port (see Figure 14). |
Figure 14: Connecting the BER Analyzer
| 6 | Run the simulation: a. Click Calculate. b. Click the Run button. The calculation progress appears in the Calculation dialog box.Note: This simulation will take some time. |
| 7 | To display the results and graphs, double-click the BER Analyzer. |
Viewing the BER Analyzer graphs and results
To view the BER Analyzer graphs and results, perform the following procedure.
| Step | Action |
| 1 | Double-click the BER Analyzer. The BER Analyzer window appears and displays a graph. |
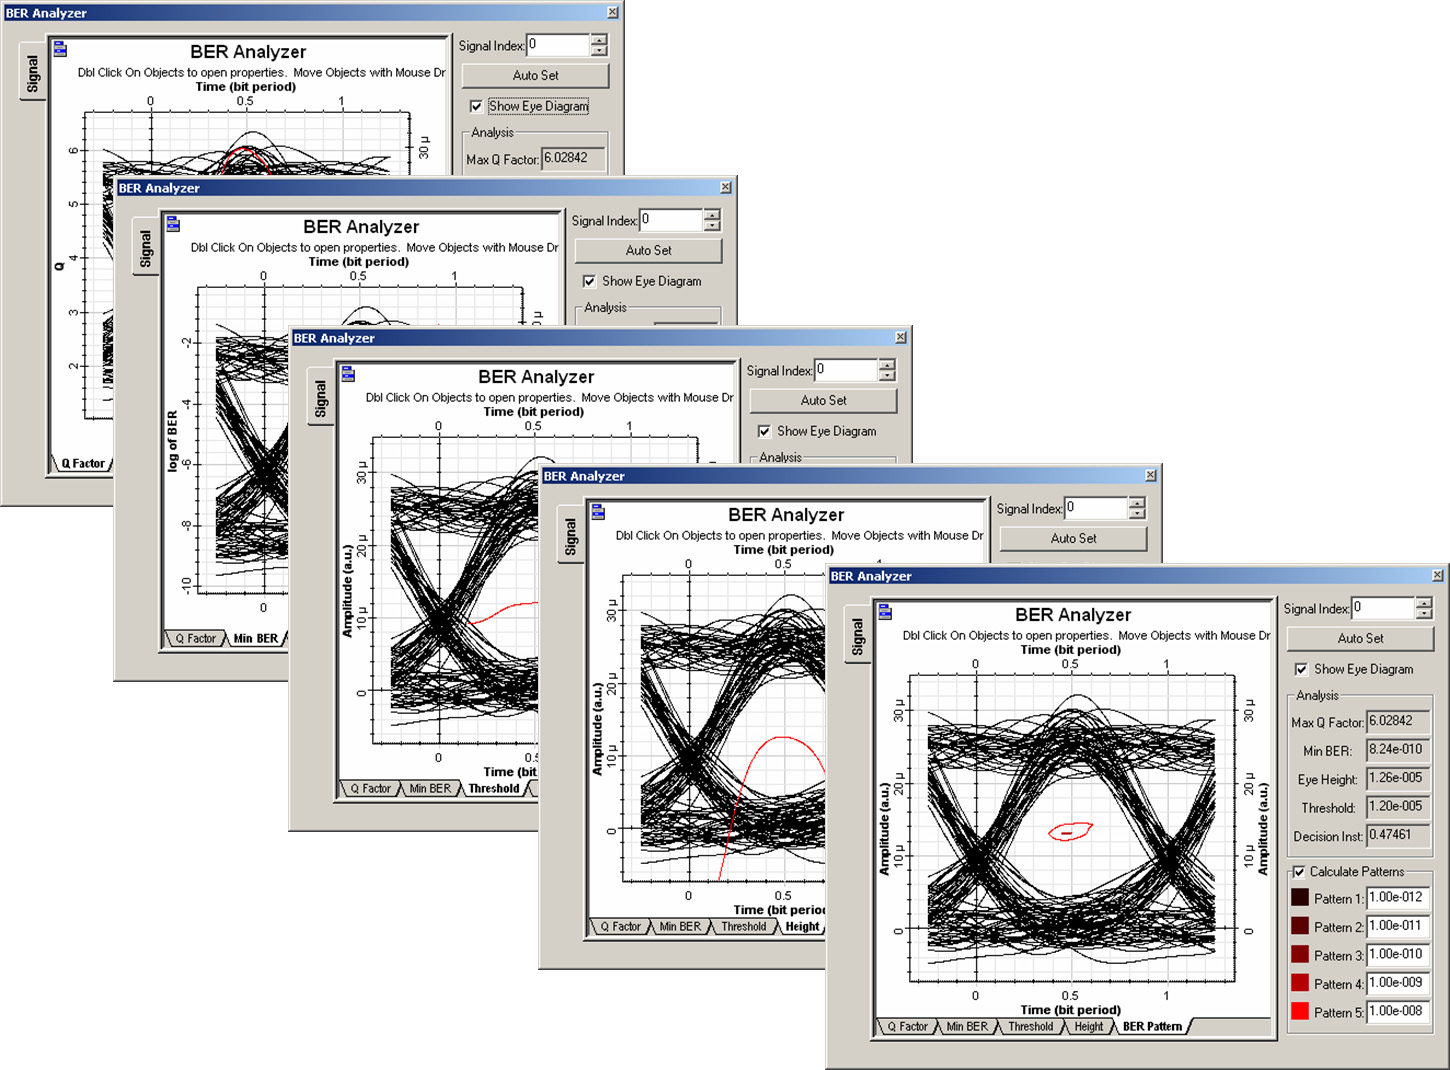
| 2 | Select Show Eye Diagram. The graph is redrawn and displays the Eye Diagram.Note: When you open the BER Analyzer, the following graphs appear together with the Eye Diagram (see Figure 15):– Q-Factor: Maximum value for the Q-Factor versus Decision Instant.– Min BER: Minimum value for the BER versus Decision Instant. – Threshold: Threshold value versus Decision Instant that gives the – Height: Eye height versus Decision Instant. – BER Pattern: When Calculate Patterns is selected, displays the regions where the BER value is less than the user-defined values. |
Figure 15: BER Analyzer graphs
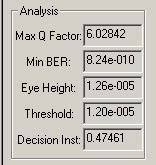
The Analysis group box displays the following values (see Figure 16):
- Maximum Q-Factor
- Minimum BER
- Maximum eye aperture
- Threshold
- Decision Instant at the Max Q-Factor/ Min BER
Figure 16: BER Analyzer results
Calculating BER patterns
To calculate the BER patterns, perform the following procedure.
| Step | Action |
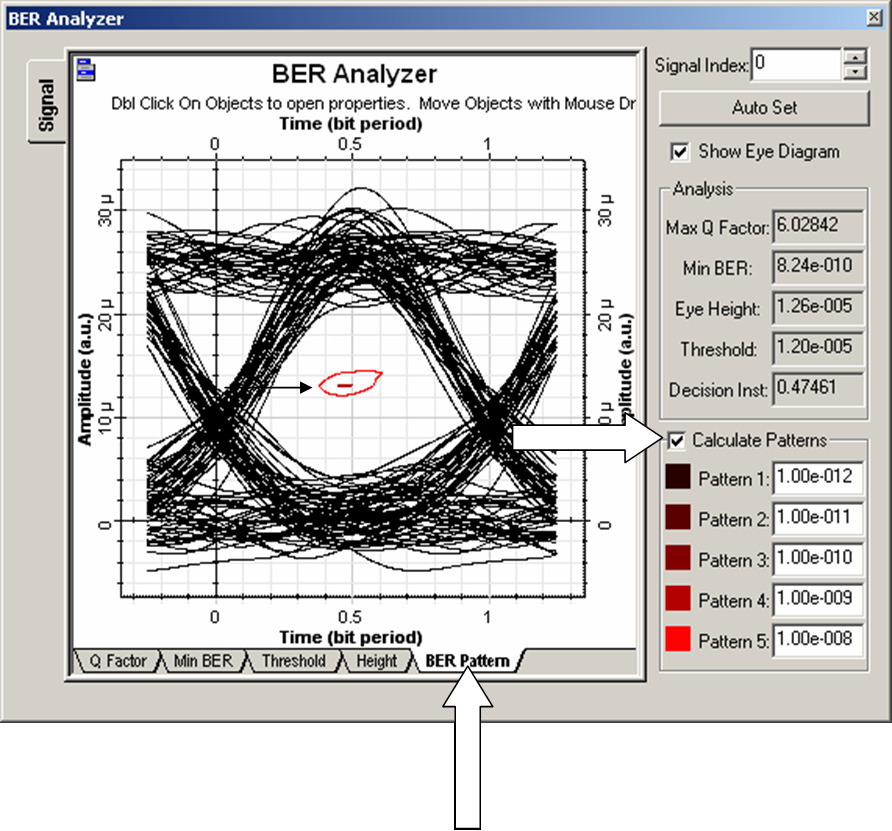
| Note: The Calculate Patterns check box is only available when you select the BER Pattern tab (see Figure 17). | |
| 1 | In the BER Analyzer window, select the BER Pattern tab. The graph changes to display the BER Patterns graph. |
| 2 | Select the Calculate Patterns check box. The visualizer recalculates the results and displays a new graph. |
Figure 17: Calculating BER patterns
Calculating the 3D BER graph
To calculate the 3D BER, perform the following procedure.
| Step | Action |
| Note: You must enable the calculation of the BER patterns and the 3D graph. | |
| 1 | Right-click the BER Analyzer. A context menu appears. |
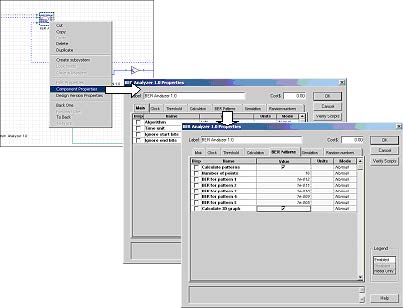
| 2 | Select Component Properties. The BER Analyzer Properties dialog box appears. |
| 3 | Select the BER Patterns tab (see Figure 18). |
| 4 | Select the Value cell beside Calculate Patterns. |
| 5 | Select the Value cell beside Calculate 3D graph. |
| 6 | In the Disp column, select Calculate Patterns and Calculate 3D graph. |
| 7 | To recalculate the results and return to the Main layout, click OK. The visualizer recalculates the graphs and results. |
Figure 18: Calculating 3D graph
Viewing the 3D graph
To view the 3D graph, perform the following procedure.
| Step | Action |
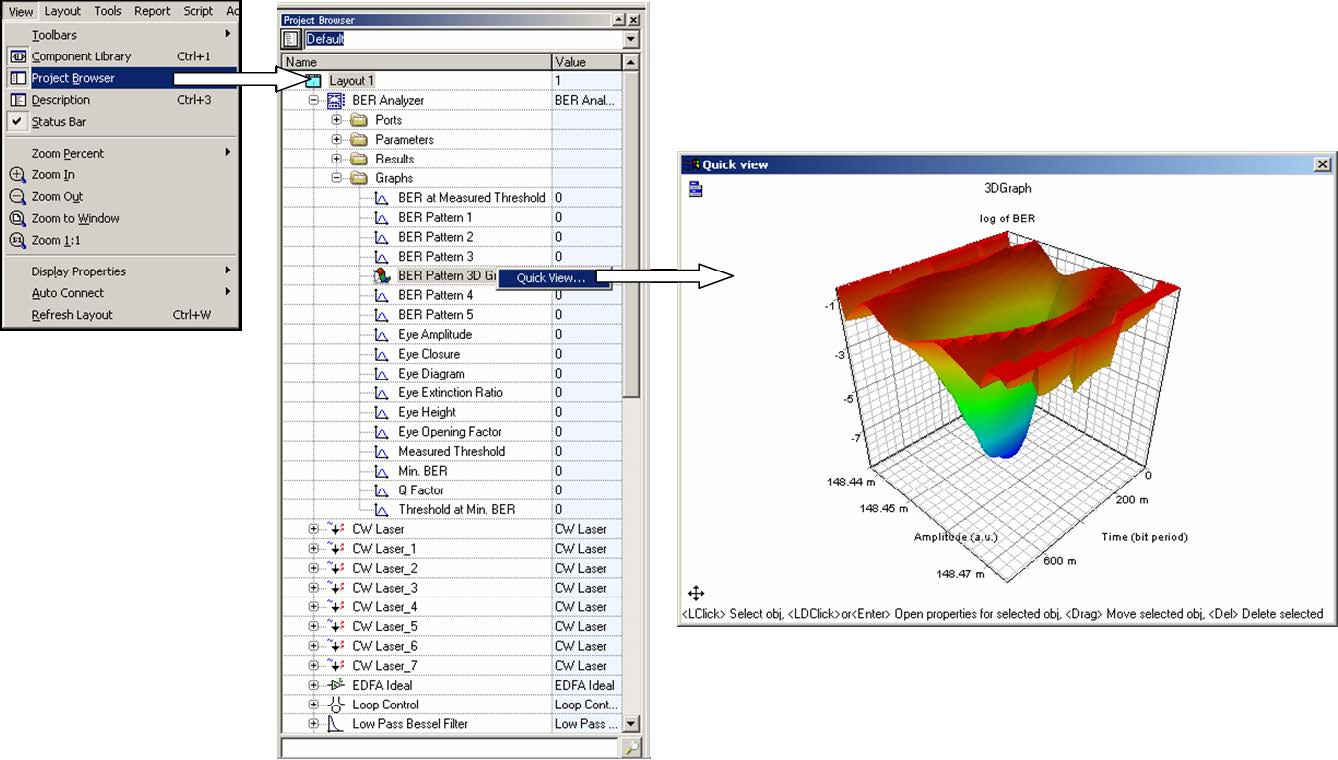
| 1 | If the Project Browser is closed: •From the Main toolbar, select View > Project Browser, or •Press Ctrl+2. |
| 2 | In the Project Browser, expand the BER Analyzer component. A list of available options appears. |
| 3 | Expand the Graphs item in the list. A list of BER Analyzer available graphs appears. |
| 4 | From the list of BER Analyzer graph items, right-click the BER Pattern 3D Graph. |
| 5 | Select Quick View. The 3D graph appears (see Figure 19). |
Figure 19: 3D graphs from the project browser


