Most installed fibers are standard single mode fibers (SMF) with high group velocity dispersion values ( ~ 16ps/nm/km ) at 1.55 µm. To achieve a good level of bit-error- rate (BER) as well as to enable larger repeater spacing and larger signal-to-noise ratio (SNR) in this type of fiber, it is very important to consider the influence of group velocity dispersion, nonlinear effects, PMD, and their interplay on the transmitted signals. Increasing the capacity of optical systems may require either an increase in the bit rate, usage of WDM or ultimately both. At high bit rates, the modulation format, type of dispersion compensation scheme, and channel power become important issues for optimum system design. In particular, it has been demonstrated numerically and experimentally that the conventional nonreturn-to-zero (NRZ) modulation format is superior compared to the return-to-zero (RZ) modulation when dealing with large WDM systems, as RZ modulation causes a significant Eye Closure Penalty near end channels. The results obtained in this tutorial will be used to compare the Eye Closure Penalties for both NRZ and RZ cases, as well as the effects of nonlinearities.
This tutorial will take you through every aspect of the design, from discussions of why certain parameters are chosen, to the significance of these parameters, and finally to the effects that these parameters have on simulated results.
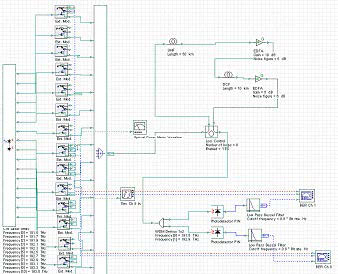
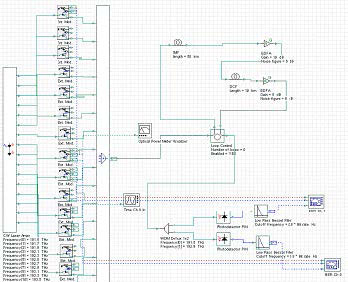
The project file, which shows the layout of the 40 Gb/s system using NRZ modulation, can be found in “16Ch NRZ 40G_Varied GVD.osd“.
Figure 1: 40 Gb/s using NRZ
This design has 16 channels, spaced 200 GHz apart, propagating through 300 km of SMF fiber. The results of the 1st channel are then analyzed (as this is the worst-case scenario).
In order to give you a clear picture of the entire design, we will look into each component individually, and discuss which parameters are important and why. We will start with the Externally Modulated Subsystem.
Externally Modulated Subsystem
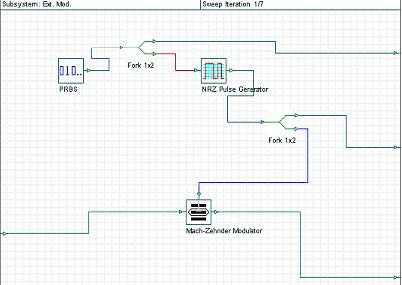
The Pseudo Random Bit Sequence (PRBS) generator, NRZ pulse generators, and Mach-Zehnder modulators, are all located inside the Subsystem (see Figure 2). The use of a subsystem illustrates the hierarchy of the system, and simplifies the entire design process.
Figure 2: Externally modulated subsystem
CW Laser Array
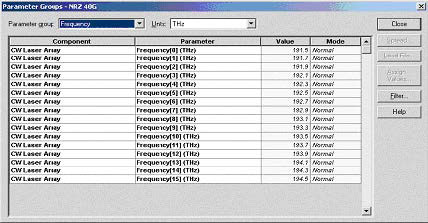
You should first enter the number of output ports, and then start inputting the Frequency values for each channel. The frequency values can be entered individually, copied/pasted from Excel, or entered in the Parameter Groups dialogue box (Figure 3). The Parameter Groups dialog box allows you to enter the first frequency value, and then increment every following frequency by a constant value. This method saves time when dealing with several channels.
Figure 3: Parameter Groups
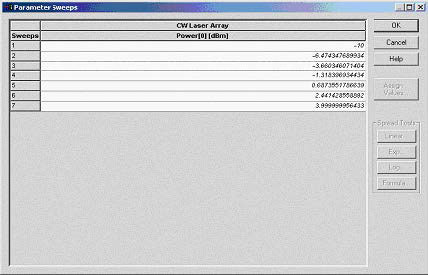
Go to the Power tab in the CW Laser Array dialog box. You will first notice that the mode for the Power is on ‘Sweep’. In this example we have chosen to run 7 different iterations, so the sweep mode allows us to change the input power for each of these 7 iterations (Figure 4). In this case, we made a sweep from -10 dBm to 4 dBm.
Figure 4: Power Sweep
Single Mode Fiber
The parameters chosen for the SMF are extremely important, and will significantly affect the simulation results. The first tab allows you to choose the length of your fiber (50 km in this case), attenuation, and input/output coupling efficiencies.
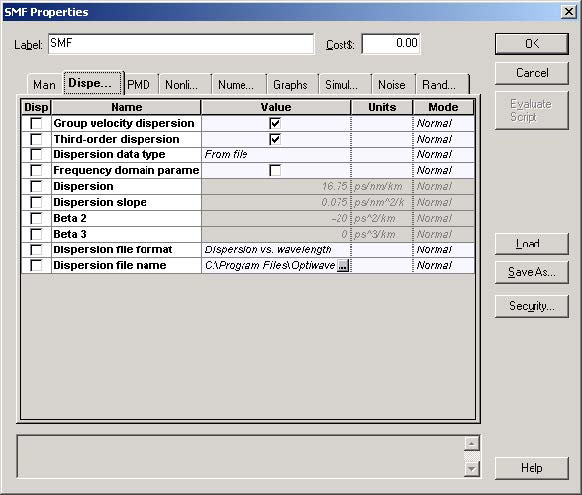
Under the Dispersion tab, you will notice that we have loaded a GVD data file (Figure 5). This file will allow us to control the dispersion spectrum. This is very important when dealing with WDM systems, because the constant dispersion slope is not accurate for channels that are located far away from the central channel.
Figure 5: Dispersion tab
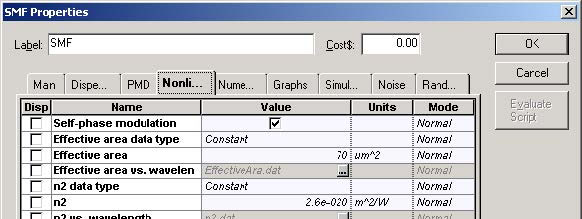
Now we will look at the Nonlinear tab (Figure 6), where you can control all of the nonlinear parameters, such as Effective Area and n2.
The most important parameter in this tab is the Effective Area. This value can be obtained from the fiber vendors.
Figure 6: Nonlinear tab
Note: The default values for the numerical parameters will work in most cases, however, when the complexity of the design increases, the importance of these parameters increases.
In summary, here are the most important parameters in the fiber component:
- Length
- Attenuation
- GVD (a data file should be used for WDM systems)
- Dispersion Slope
- Effective Area
- Proper selection of Effects
- Numerical Details (for larger and more complicated systems)
If all these parameters are entered correctly, the accuracy of the simulation will be extremely high. Most of these parameters can be obtained directly from fiber vendors, however, if you are having difficulty finding them, please download some of the scientific papers that are available on our website.
EDFA
The next component we will look at is the Erbium Doped Fiber Amplifier. In this tutorial we use an Ideal EDFA model, which is only concerned with the values of Gain and Noise Figure. These two values are fairly straightforward, as the Gain is set to compensate for the power loss in the fiber, and the Noise Figure is set to a standard value of 6 dB. The next step is to set the Noise parameters to include the noise over the entire simulated bandwidth (Figure 7). In this case, we set the center frequency equal to that of the central channel, and the bandwidth to a value that would include all neighboring channels. Then we choose a bin spacing that will be small enough (to increase accuracy) but not too small.
Figure 7: Noise parameters
DCF
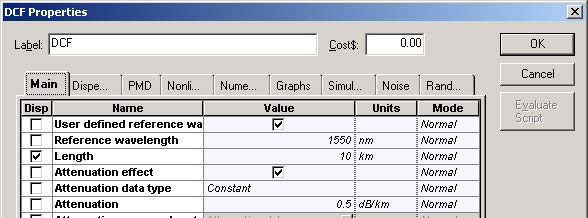
The Dispersion Compensating Fiber parameters were chosen similar to the SMF. However, in this case we want to set the Length, GVD, and Dispersion Slope as to perfectly compensate for the dispersion accumulated in the SMF component (see Figure 8).
Figure 8: DCF Main properties
WDM Demux
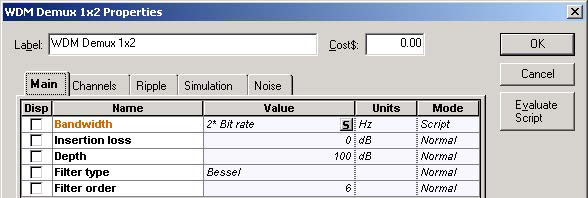
In this component we are filtering out the 1st and 8th channels, and analyzing the 1st channel using the BER Analyzer (Figure 9). It is very important in the Mux/Demux components to properly set the filter shape and bandwidth, as to properly filter out the channels. The user should also remember to set the appropriate center frequencies for each channel.
Figure 9: WDM Demux Main properties
Remaining Components
The rest of the components are very simple, and most of the time, will work fine with their default values. I suggest only modifying default parameters, if you are confident that the changes you are making are correct.
Each of these components was modeled from a validated scientific paper. The parameters chosen as defaults were based on industry standards. All references are given in the Technical Background of each component.
Layout Parameters
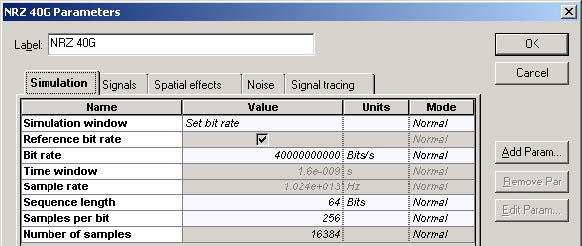
Choosing proper global parameters is very crucial when trying to obtain accurate results. The Layout Parameters dialog box can be opened by double-clicking anywhere on the layout (Figure 10).
Figure 10: Layout parameters
Now here is a set of rules that will help you in your designing process:
Quick Simulation (fairly accurate results)
- Sequence length = 64
- Samples per bit = 64
Note: For large WDM systems, you may want to try decreasing these numbers to
16, however, erroneous results may occur.
Long Simulation (more accurate results)
- Sequence length > 64 and < 1024
- Samples per bit > 64 and < 1024
Note: The best suggestion would be to use 128 for both the length and samples per bit.
In this tutorial, we use a Sequence length = 64, so that we can properly compare with the following scientific paper: “M.I. Hayee and A.E. Willner, “NRZ Versus RZ in 10-40 Gb/s Dispersion – Managed WDM Transmission systems”, IEEE Photon. Technol. Lett., vol. 11, pp.991-993, 1999.”
We also use a Sample rate of 10.24 THz, so that all the channels are combined into 1 single band.
The Signals tab, allows you to simulate Parameterized signals (signals that have only 1 power and 1 frequency) instead of Sampled signals (Figure 11). This is very useful for large WDM systems where a power budgeting analysis is required. By parameterizing the signals, the simulation will run almost instantly, allowing you to make designs that are complex, require many iterations/optimizations, and have several channels.
Figure 11: Signals tab
The Noise tab allows you to convert the noise bins into signals. This will then add the noise and signals together, rather than propagating them as separate arrays.
Conclusion regarding parameter selection
Selecting the proper parameters is the most important step when designing an entire system. Many components/parameters are not known well by users, so they may find it difficult to set all parameters properly. We suggest that at a minimum, the system designer set the proper parameters in the fiber components, amplifiers, and WDM components. These key components have the greatest effect on the outcome of your results.
When you are familiar with the components, you can start simulating. You should start off with fast simulations, in order to narrow down major design problems, and then change the Layout parameters accordingly, to increase the accuracy of your simulation. This will save time in system design, and the outcome should be more satisfying.
Results of NRZ simulation
After simulating the design, we can analyze any port that has a monitor attached to it. You can identify which ports have monitors attached, because there will be boxes around them (see Figure 12 for an example).
Figure 12: Monitors
You can put a monitor on any output port you want—simply click on the monitor tool, and then click on the output ports you wish to analyze. When this is done, you can simulate your project, and all the data will be saved.
Note: A monitor is automatically attached if a visualizer is attached to that port.
In this specific design, we have the following 3 types of visualizers connected to our system:
Optical Power Meter: shows the total power at a specific location in the system (see Figure 13).
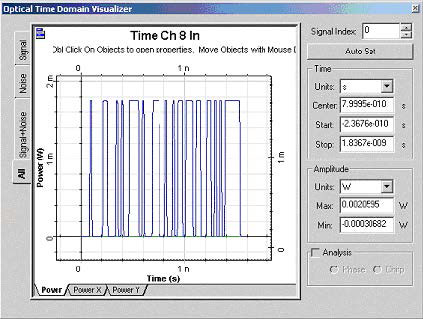
Optical Time Domain Visualizer: displays the Time Domain information for the 8th channel (see Figure 13).
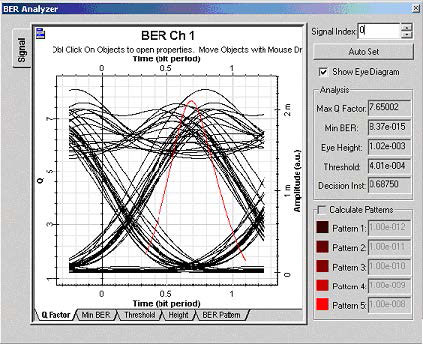
BER Analyzers: displays the Eye Diagram, Q-factor curve, Min BER, Threshold, Eye Height, and BER Patterns for the 1st and 8th channel (see Figure 14).
Figure 13: OTDV for Channel 8
Figure 14: BER Analyzer for Channel 1
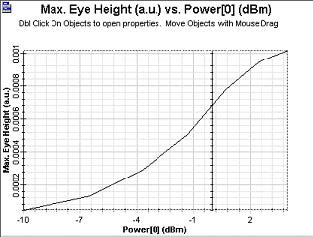
For the purposes of this tutorial, we are concerned with the Eye Height values obtained from the best (8th channel) and worst (1st channel) scenarios.
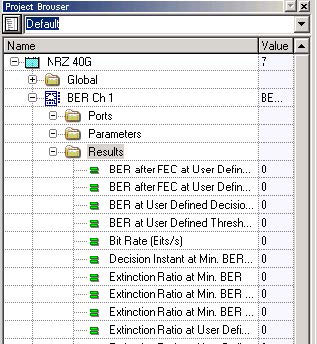
The best way to obtain this information quickly and efficiently is to use the Project Browser. This will allow us to display the data for all iterations on a single spreadsheet.
Figure 15: Results tab display
For all 7 iterations, the Max Eye Height for channels 1 & 8 and the Total Input Power have been calculated. This allows us to construct a graph of Eye Closure Penalty vs. Input Power. However, to construct such a Graph, we will need the results from the back-to-back system (MUX ® DEMUX).
These results have been calculated in “16Ch NRZ Ideal.osd“. We also calculated the same system without the nonlinear effects in “16Ch NRZ 40G_Varied GVD_Xnonlinear.osd“.
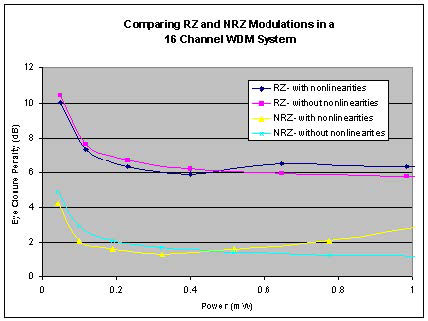
The entire process was then repeated using RZ modulation. When all the data was collected, and the Eye Closure Penalty was calculated, the graph (Figure 16) was generated.
This graph shows the relationship that RZ and NRZ modulation have on input power. It also shows the difference obtained when taking into account the nonlinear effects. These results have very good agreement with the published results of Willner’s paper [1], and suggest to system designers that the use of NRZ modulation becomes very important when dealing with WDM systems that have many channels.
32 Channels
In this part of the tutorial, we are expanding our system from 16 channels to 32 channels. In this case, we simply added 8 channels at both the beginning and the end of our 16 channel system. The frequencies and powers were then modified, so that they could be integrated with the rest of the system.
After running all 3 simulations (ideal, with nonlinearities, and without nonlinearities) and calculating the results, the graph in Figure 18 was generated.
Figure 18: Eye Closure Penalty versus Power (32 Channels)
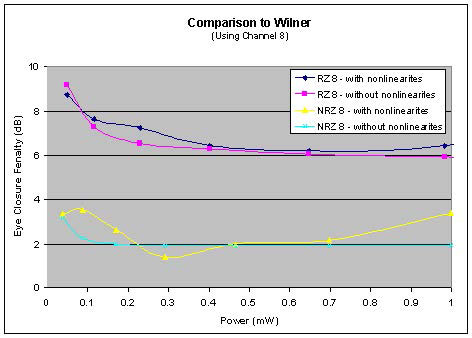
Since the Eye Closure Penalty was far too high for the end channels (in the case of RZ), the 8th channel was used instead. The results correlate to those in the 16 channel design, and suggest that we have obtained good agreement with Willner’s paper [1].
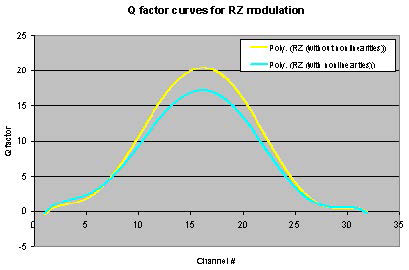
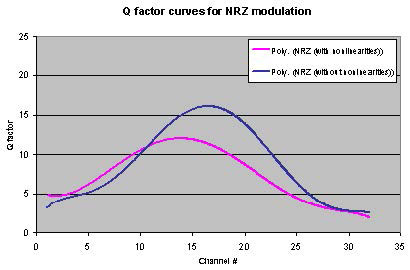
One very important aspect of WDM system design is the Q-factor of the worst-case scenario. In both the RZ and NRZ cases, the worst Q-factor comes from the 1st and 32nd channels (end channels), as they experience the most dispersion. As a full analysis, we have constructed curves to demonstrate the relationship between Q-factor and Channel #, for both the RZ and NRZ cases (Figure 19 and Figure 20).
Figure 19: Q-factor versus Channel # for RZ modulation
Figure 20: Q-factor versus Channel # for NRZ modulation
Discussion
As you went through this tutorial, you have learned that there are many factors that are crucial in obtaining good results, such as fiber and laser settings, layout parameters, and proper setup of the system. Most designers do not have knowledge about every component in an optical system, and usually have less knowledge about the simulation parameters. Therefore, it is suggested that small steps be taken through the design process—start with a few components, test the design, and then slowly add more components to it. Being hasty in the design process can cause you problems in the long run.
When we analyzed a 16 channel, 40 Gb/s system using both RZ and NRZ modulation techniques, the results we obtained agreed well with scientific papers, and suggested that NRZ modulation was the superior technique when dealing with large WDM systems. The curves of Eye Closure Penalty versus Input Power demonstrated that NRZ modulation works better for both low and high input powers, regardless of the fact that NRZ is more affected by the nonlinearities in the high power regime.
We then expanded our system to 32 channels, where we obtained results that correlated well with those of the 16 channel system. As a further investigation into the system performance, we graphed the Q-factors versus Channel #, and found that the Q-factors for the RZ modulation dropped off much quicker than those for the NRZ modulation. This demonstrates once again that RZ modulation performs worse than NRZ when the number of channels in the system becomes significant.
Note: The default layout parameters have been set slightly different from those used in this tutorial, in order to provide you with a much quicker analysis of the design.
Reference:
[1] M.I. Hayee, and A.E. Willner, “NRZ Versus RZ in 10-40-Gb/s Dispersion managed WDM transmission systems”, IEEE Photon. Technol. Lett., vol. 11, pp.991-993, 1999.


