In the previous three lessons, we assumed that the input pulse was much shorter than the carrier lifetime. When the pulse width becomes comparable to the carrier lifetime, the saturated gain has time to recover during the pulse. The recovery effect influences the shape and spectrum of the amplified pulse.
This lesson studies this influence. Three subtopics will be discussed:
- Partial gain recovery
- Complete gain recovery
- Appearance of gain-saturation induced self-phase modulation
SOA parameters
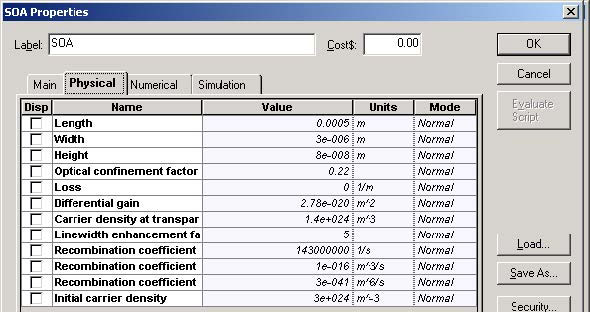
The carrier lifetime tC ~ 1.4 ns, Γ= 0.22, Esat = 5 pJ.
The unsaturated single pass amplifier gain ~30 dB. Inner loss = 0 makes the comparison with [1] possible
See Figure 1 for SOA Physical parameters.
Figure 1: SOA parameters
Partial gain recovery
Because the carrier lifetime of our SOA is tC ~ 1.4 ns, pulse widths have to be smaller than 1.4 ns in order to be able to see the partial gain recovery. Keeping the ratio Ein/Esat, we will consider the influence of increasing the pulse duration, which will approach but remain smaller than the carrier lifetime.
Calculation parameters:
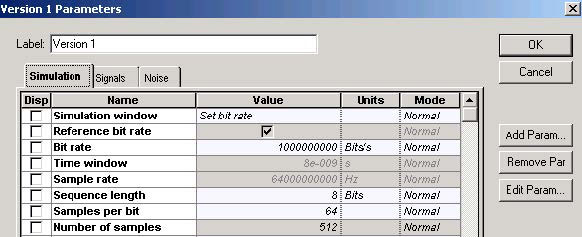
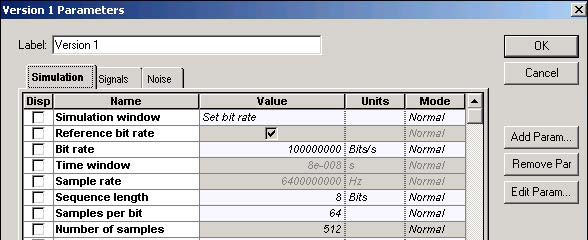
- Bit rate at B= 1 GHz, consequently TB = 1 ns.
See Figure 2 for the global parameters.
Figure 2: Global parameters
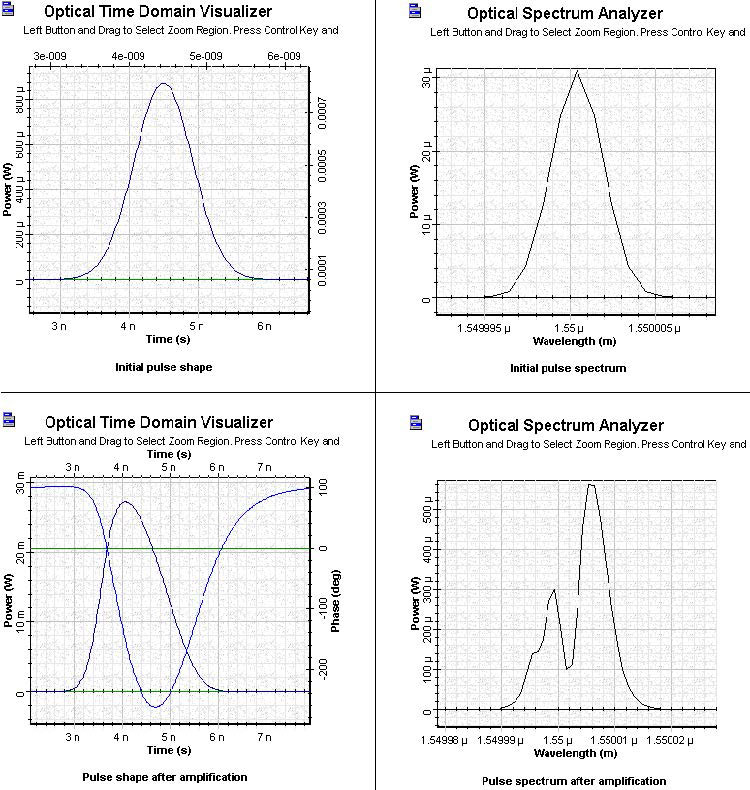
We will consider three pulse widths — 0.25ns, 0.5 ns, and 1 ns. In all three cases, the ratio Ein / Esat = 0.1 will remain constant.
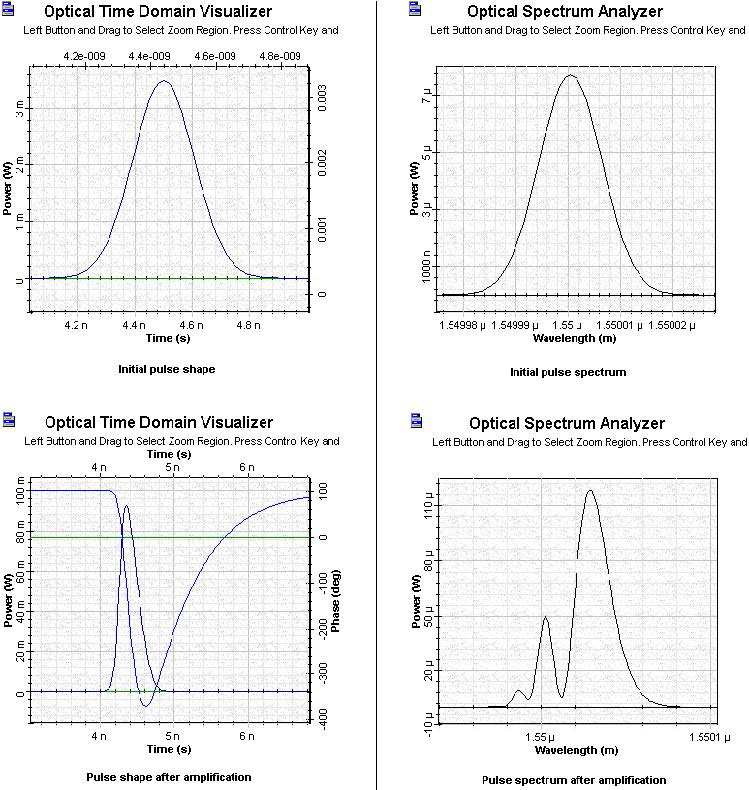
Pulse 1 parameters
- Duty cycle 0.25, TFWHM ~ 0.25 ns → T0 ~ 0.14 ns, Pin = 3.5 mW
- Therefore: T0 / tC ~ 0.1 and Ein/Esat ~ 0.1
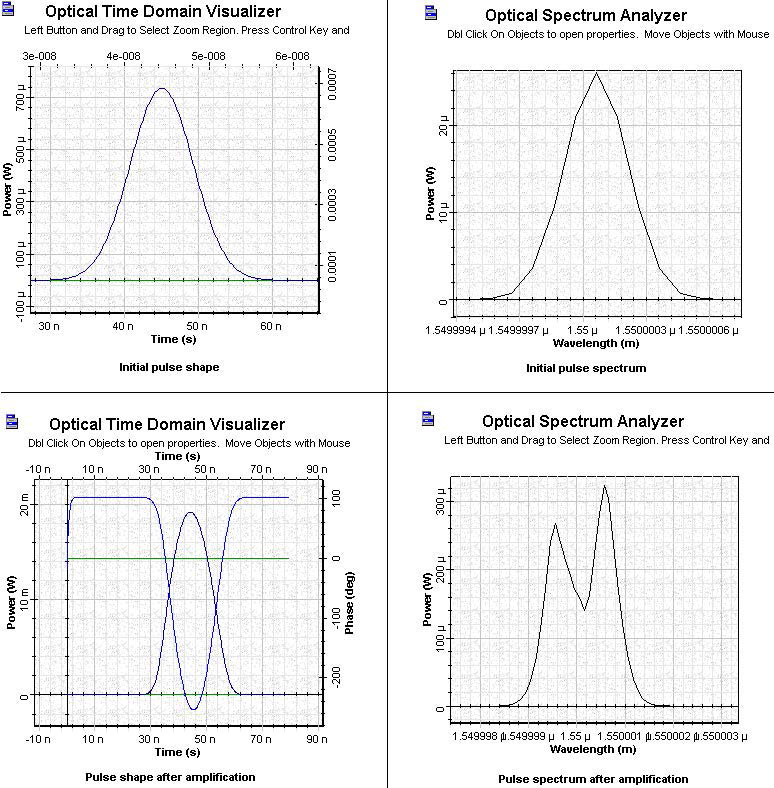
Figure 3 shows the shape and spectra of the initial and amplified pulses for Pulse 1.
Figure 3: SOA Gaussian Pulse 1 initial and amplified pulses
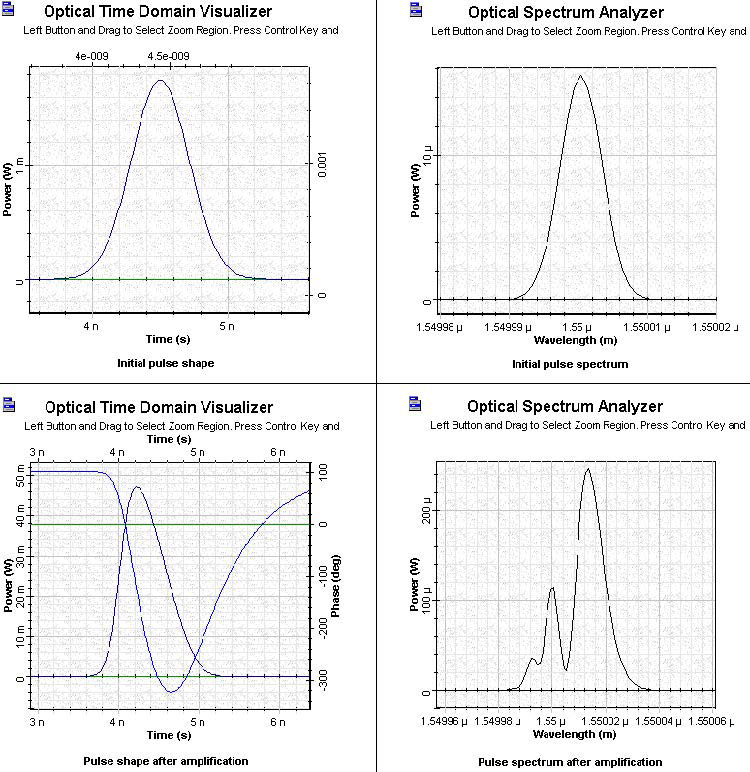
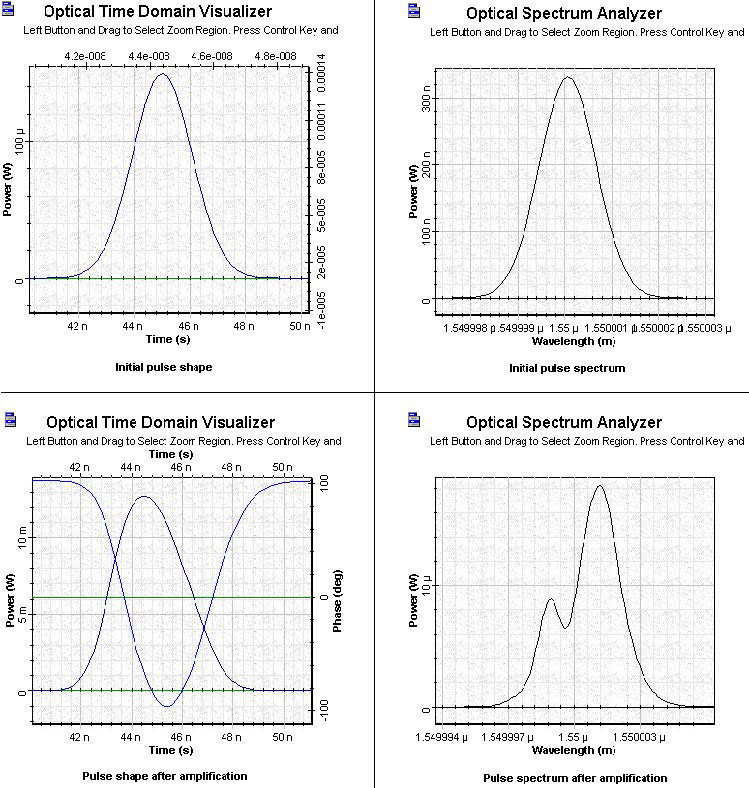
Pulse 2 parameters
- Duty cycle 0.5, TFWHM ~ 0.5 ns → T0 ~ 0.28 ns, Pin = 1.75 mW
- Therefore: T0 / tC ~ 0.2 → Ein / Esat = 0.1
Figure 4 shows the shape and spectra of the initial and amplified pulses for Pulse 2.
Figure 4: SOA Gaussian Pulse 2 initial and amplified pulses
Pulse 3 parameters
- Duty cycle 1, TFWHM ~ 1 ns → T0 ~ 0.567 ns, Pin = 0.875 mW
- Therefore: T>0 / tC ~ 0.4 and Ein / Esat = 0.1
Figure 5 shows the shape and spectra of the initial and amplified pulses for Pulse 3.
Figure 5: SOA Gaussian Pulse 3 initial and amplified pulses
The following properties for these three amplified pulses can be distinguished.
- By increasing the pulse width and keeping the ratio Ein/Esat = 0.1, the pulse shape becomes less asymmetrical and broader than the input pulse.
- By increasing the pulse width, the spectrum becomes less asymmetrical and the spectral shift decreases. Note the behavior of the phase shown in the shapes of amplified pulses.
As the phase of the amplified pulse brings information for the gain, the gain does not have enough time to recover completely. (Compare the gain evolution in these three examples with the results of SOA gain saturation—Gaussian pulses.)
Complete gain recovery (quasi-CW operation)
With the carrier lifetime of our SOA at tC ~ 1.4 ns, we will consider pulses with widths larger than 1.4 ns.
Bit rate B= 100 MHz, consequently TB = 10ns.
Figure 6: SOA Gaussian Pulse Simulation parameters
We will consider three pulse widths — 2.5ns, 5 ns, and 10 ns. In all three cases, the ratio Ein / Esat = 0.1 will remain constant.
Pulse 4 parameters
- Duty cycle 0.25, TFWHM ~ 2.5 ns → T0 ~ 1.4 ns, Pin = 0.15 mW
- Therefore: T0 / tC ~ 1.8 and Pin / Psat = 0.04
Figure 7 shows the shape and spectra of the initial and amplified pulses for Pulse 4.
Figure 7: SOA Gaussian Pulse 4 initial and amplified pulses
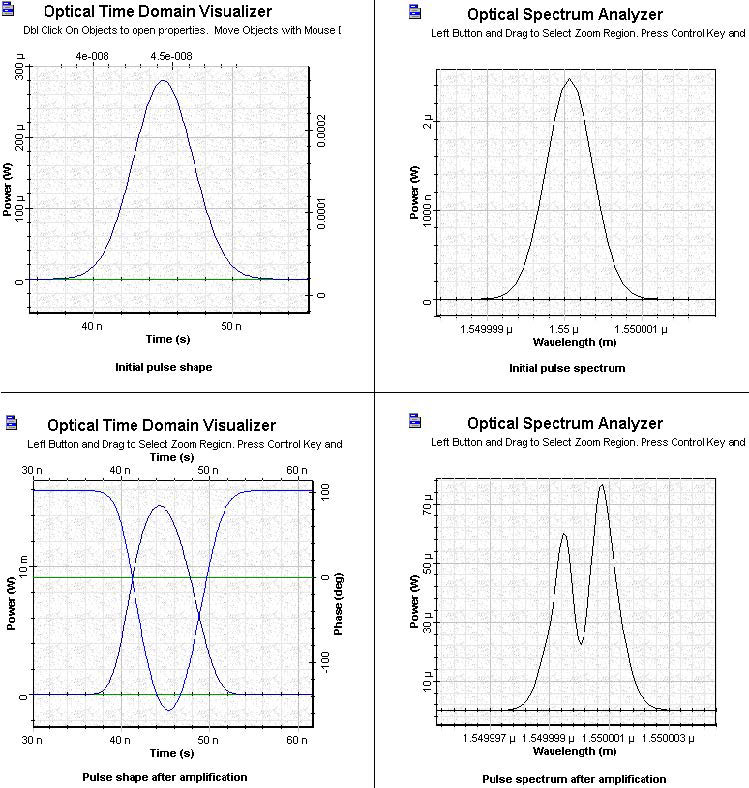
Pulse 5 parameters
- Duty cycle 0.5, TFWHM ~ 5 ns → T0 ~ 2.83 ns, Pin = 0.28 mW
- Therefore: T0 / tC ~ 3.6 and Pin / Psat = 0.08
Figure 8 shows the shape and spectra of the initial and amplified pulses for Pulse 5.
Figure 8: SOA Gaussian Pulse 5 initial and amplified pulses
Pulse 6 parameters
- Duty cycle 1, TFWHM ~ 10 ns → T0 ~ 5.67 ns, Pin = 0.736 mW
- Therefore: T0 / tC ~ 7.1 and Pin / Psat = 0.2
Figure 9 shows the shape and spectra of the initial and amplified pulses for Pulse 6.
Figure 9: SOA Gaussian Pulse 6 initial and amplified pulses
The following properties for these three amplified pulses can be distinguished.
- By increasing the pulse width well above the carrier lifetime, the shapes of the amplified pulses are much more symmetrical. The shapes also become much broader than the shapes of the corresponding initial pulses.
- By increasing the pulse width, the spectrum of the amplified pulses becomes less asymmetrical and the red shift continuously decreases.
The phase is shown in the figures of the shapes of amplified pulses. We see that for these pulses, the gain has time to recover completely.
Appearance of gain-saturation induced self-phase modulation
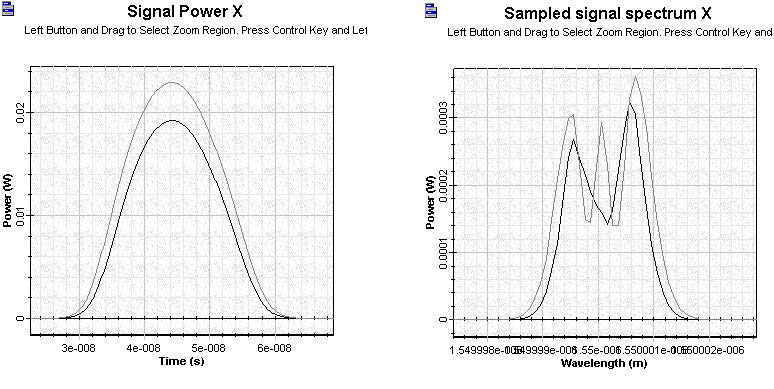
Now we will compare the results of Pulse 6 (Pin / Psat = 0.2) with the results for Pin / Psat = 0.4. We will make this comparison by increasing the initial power 10 times. Figure 10 shows the results of this comparison for the shapes and spectra of the amplified pulses.
Figure 10: Comparison of results for Pin / Psat = 0.2 with Pin / Psat = 0.4
The spectra obtained in the complete gain recovery examples (especially in the last example) exhibit a structure similar to that of the pulse obtained in the propagation in medium with Kerr nonlinearity [2]. This spectra allows the introduction of the concept of gain saturation-induced self-phase modulation [1]. These kinds of spectra are only possible when the pulses are longer than the carrier lifetime.
References:
[1] G.P. Agrawal and N.A. Olsson, “Self-phase modulation and spectral broadening of optical pulses in semiconductor laser amplifiers”, IEEE Journal of Quantum Electronics, Vol. 25, pp. 2297-2306, 1989.
[2] G.P.Agrawal, “Nonlinear Fiber Optics,” 3rd Edition, Academic Press, 2001.


