The spectral distribution of the optical source determines the performance of the optical system through the dispersion [1], [2]. The spectral distribution of the LED is determined by the spectrum of spontaneous emission, which typically has a Gaussian shape. In the 1300-1500nm region, the spectral widths of the LED vary from 50 to 180nm.
The spectral width of the LED with 1300 nm wavelength is analyzed. The project is shown in Figure 1.
Figure 1: Project layout
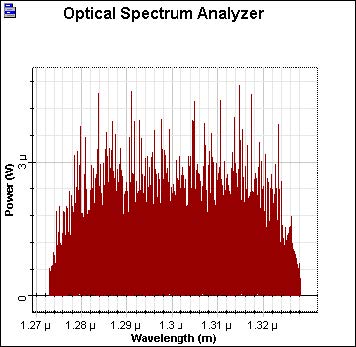
Discussion of the numerical parameters: bit rate is 300Mb/s and sequence length 2 bits, therefore, the time window is 6.66ns. Samples per bit are 32768, therefore, the sample rate is 10THz (56nm). The default resolution therefore is 0.0017nm.
Figure 2: Spectral distribution
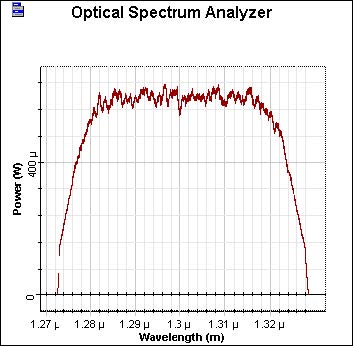
This spectral distribution is obtained with the default resolution. The resolution can be changed in the resolution bandwidth of the optical spectrum analyzer. In Figure 3, the same spectral distribution with a resolution from 1 nm is depicted.
Figure 3: Spectral distribution—resolution from 1nm
Approximately 50 nm spectral width of the optical source can be seen.
References
[1]G.P. Agrawal, Fiber-Optic Communication Systems, John Wiley & Sons, Inc, second edition, 1997.
[2]G. Keiser, Optical Fiber Communications, McGraw-Hill Higher Education, third edition, 2000.


