The frequency response of an LED is determined by the carrier dynamics (and therefore is limited by the carrier lifetime Tn) and the parasitic capacitance of the LED (described by the RC constant TRC[2].
If a small, constant forward bias is applied, the influence of the parasitic capacitance of the LED can be neglected. The LED 3-dB modulation optical bandwidth is defined as the modulation frequency at the LED power transfer function is reduced by 3 dB [1]. The LED 3-dB modulation optical bandwidth could be expressed as:
ƒ3dB = √3 / 2π / (Tn + TRCn).
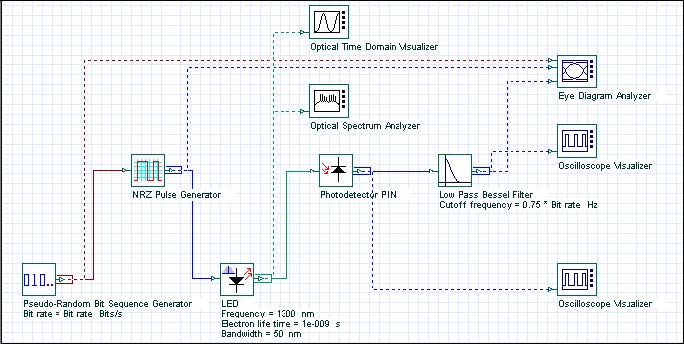
We would like to demonstrate the modulation response properties of the LED. The project is depicted in Figure 1.
Figure 1: Project layout
The default values of the carrier lifetime Tn and the RC constant TRC, are 1 ns and
1 ns, respectively. Therefore, the ƒ3dB is approximately 140 MHz.
Discussion of the numerical parameters: for example, bit rate is 300 Mb/s and sequence length 128 bits, therefore, the time window is about 430 ns. Samples per bit are 256, therefore, the sample rate is 76 GHz. The default resolution therefore is about 2 MHz.
Let us first keep the carrier lifetime Tn and the RC constant TRC, which means ƒ3dB
is about 140 MHz, and analyze the closure of the eye diagram as a measure for the
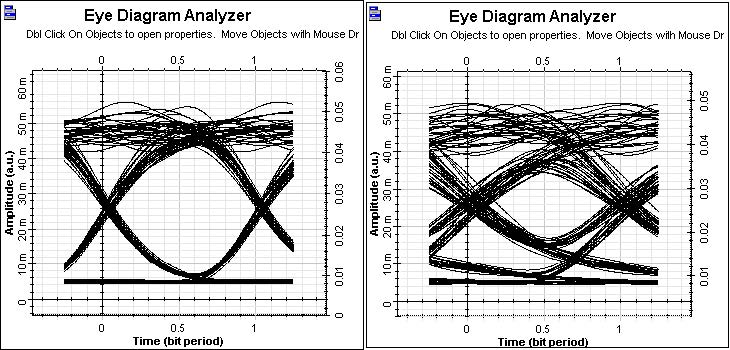
performance of the system. The results for 100Mb/s and 300Mb/s transmission are
shown in Figure 2.
Figure 2: System performance with increased bit rate
Clearly the performance of the digital system is considerably worsened by increasing the bit rate above the LED 3-dB modulation optical bandwidth.
The influence of the modulation response of the LED can be studied also by keeping
the bit rate, for example 300 Mb/s, and reducing the carrier lifetime Tn and the RC
constant TRC, therefore increasing ƒ3dB . Let us assume Tn = TRC = 0.5ns,
therefore ƒ3dB will be about 280MHz.
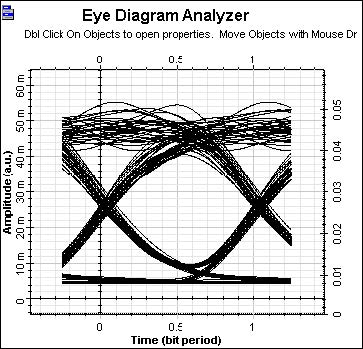
A large improvement in the system performance at 300 Mb/s compared to the latest figure should be seen. This is illustrated in Figure 3.
Figure 3: Improved system performance at 300Mb/s
References
[1]G.P. Agrawal, Fiber-Optic Communication Systems, Joinery & Sons, Inc, second edition, 1997.
[2]G. Keiser, Optical Fiber Communications, McGraw-Hill Higher Education, third edition, 2000.


