OptiSystem allows the user to optimize the layout in a variety of ways.
User-defined optimizations allow the user to select a parameter and then select a result. The parameter is then manipulated through a number of iterations in order to hit the target value of the result.
The user can select a target gain or output power that is measured with the WDM Analyzer and OptiSystem will search for the pump power to achieve the target value.
Loading the project
- Go to the OptiSystem sample files folder, “…Optiwave SoftwareOptiSystem 9SamplesOptical amplifiers”.
- Open the Project “Automatic Control.osd”.
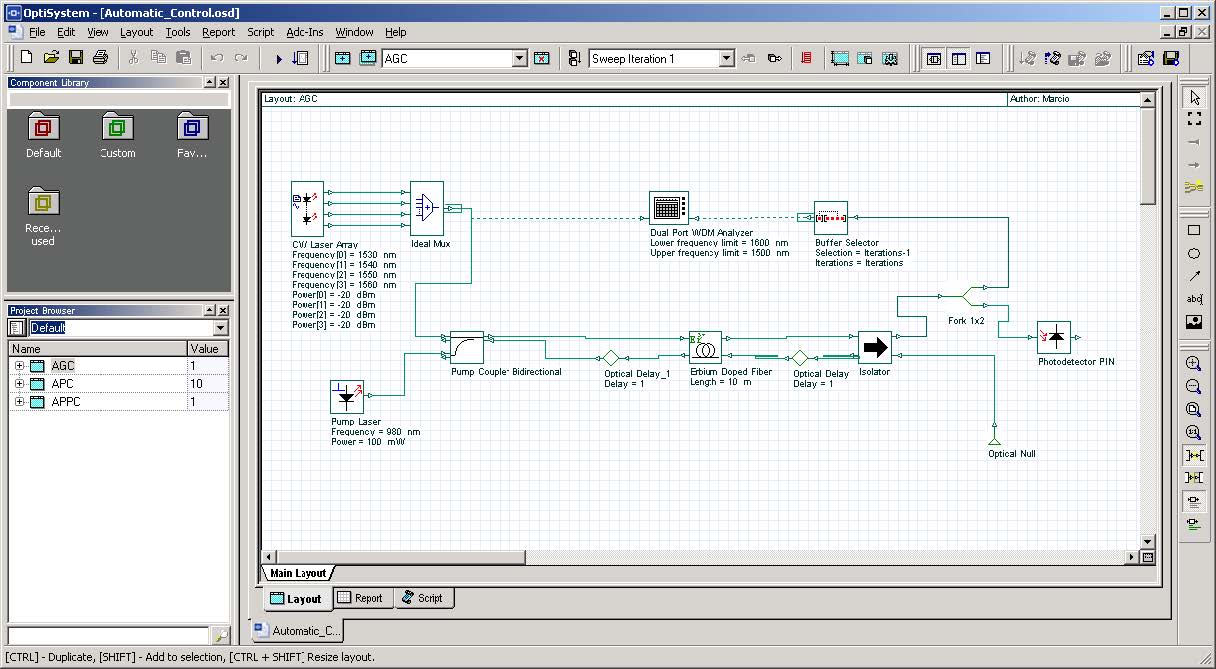
Figure 1 presents the amplifier layout.
This project has three layout versions:
- Automatic Gain Control (AGC)
- Automatic Power Control (APC)
- Automatic Peak Power Control (APPC)
Figure 1: Project “Automatic Control.osd”
Automatic Gain Control
The automatic gain control (AGC) maintains the EDFA gain at a fixed level during signal perturbations or changes in the system loss.
The implementation of AGC using OptiSystem requires inserting a WDM Analyzer between the two points of interest (to calculate the gain) and adding and configuring optimizations.
Because we want to keep the total gain constant while controlling the pump power, we need the WDM Analyzer (Figure 1) to calculate the gain and the optimization engine to calculate the pump power to achieve this gain.
Automatic Power Control
The procedure to obtain Automatic Power Control (APC) is the same as that used to obtain AGC. However, instead of monitoring the gain, we will monitor the total output power.
We are assuming that the total output power must be kept constant by controlling the pump power.
We need to insert a WDM Analyzer in the layout to calculate the signal output power and set an optimization to calculate the pump power to achieve the target signal output power.
Automatic Peak Power Control
The procedure to achieve Automatic Peak Power Control (APPC) is the same used to obtain APC and AGC. However, instead of monitoring the total gain or total output power, we will monitor the output power of one signal at a particular wavelength.
We are assuming that the total output power must be kept constant by controlling the pump power. We need a probe to calculate the signal power and an optimization to calculate the pump power to achieve this signal power.
Optimization
We will demonstrate the setup for the AGC.
For this setup, the user must select the
- parameter to be optimized (the pump power)
- result to be monitored (the total gain)
- range with a target value.
The other two types of control follow the same basic steps.
- To open the simulation setup, you can go to the File menu and select Calculate. You can also press Control+F5 or use the calculate button in the toolbar. After you select Calculate, the calculation dialog box should appear.
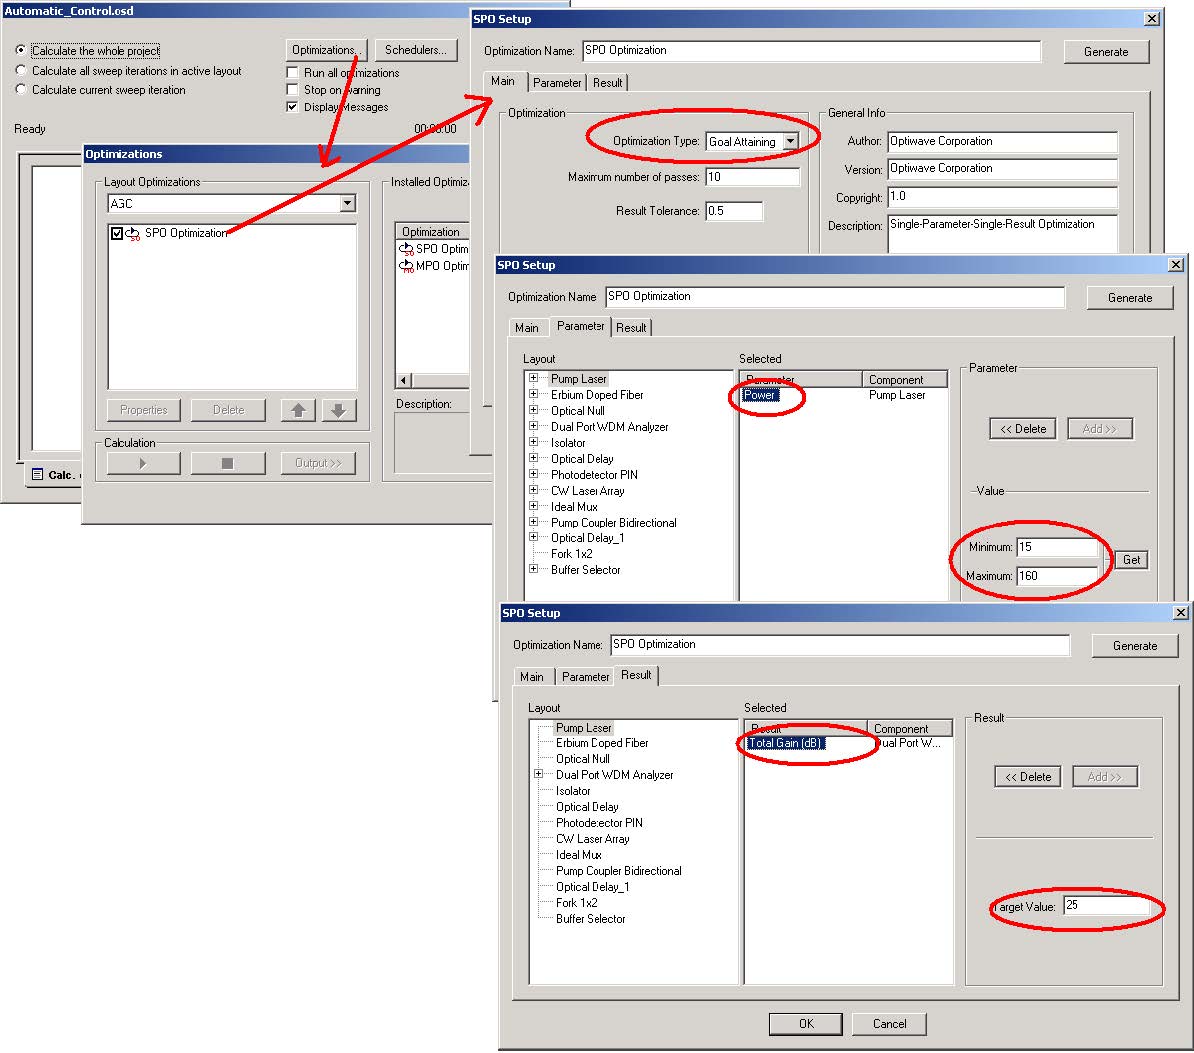
- In the calculation dialog box, press the ‘Optimizations…’ button (Figure 2).
- Double-click on the SPO (single parameter optimization) Optimization item.
The SPO optimization parameters are described in Figure 2.
The user set the optimization type to goal attaining. The goal is to control the parameter Power from the Pump Laser to reach the target Total Gain from the WDM Analyzer.
Pump power varies from 15 to 165 mw, and the gain target is 25 dB.
Figure 2: Optimization set-up for AGC amplifier
Running the simulation
- To run the simulation, you can go to the File menu and select Calculate. You can also press Control+F5 or use the calculate button in the toolbar. After you select Calculate, the calculation dialog box should appear.
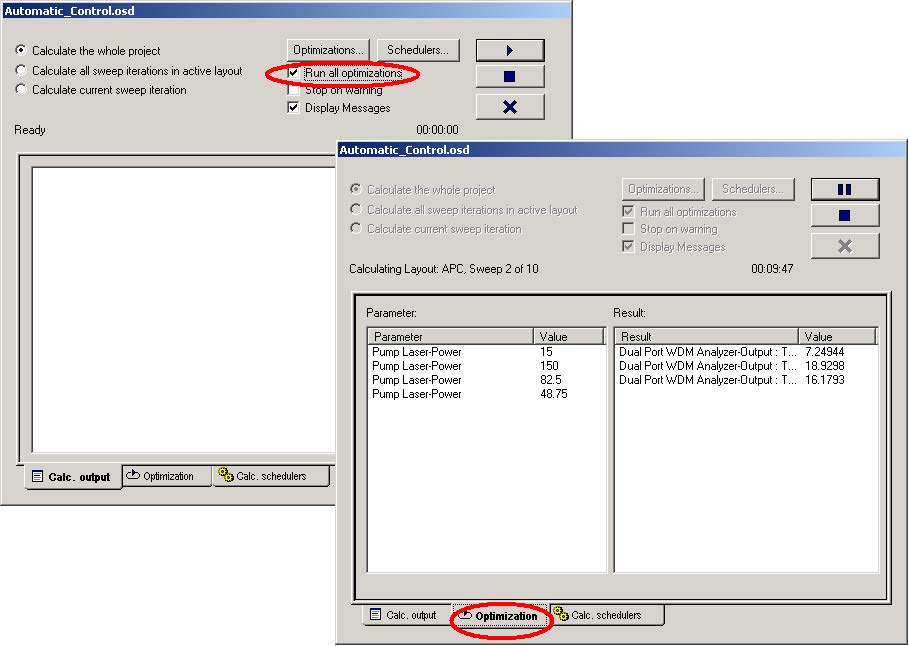
- In the calculation dialog box, enable ‘Run all optimizations…’ (Figure 3).
- Press the Play button.
- Select the Optimization tab in order to monitor the progress of the Optimizations (Figure 3).
Figure 3: Calculating project
Viewing the results
- Go to the report page.
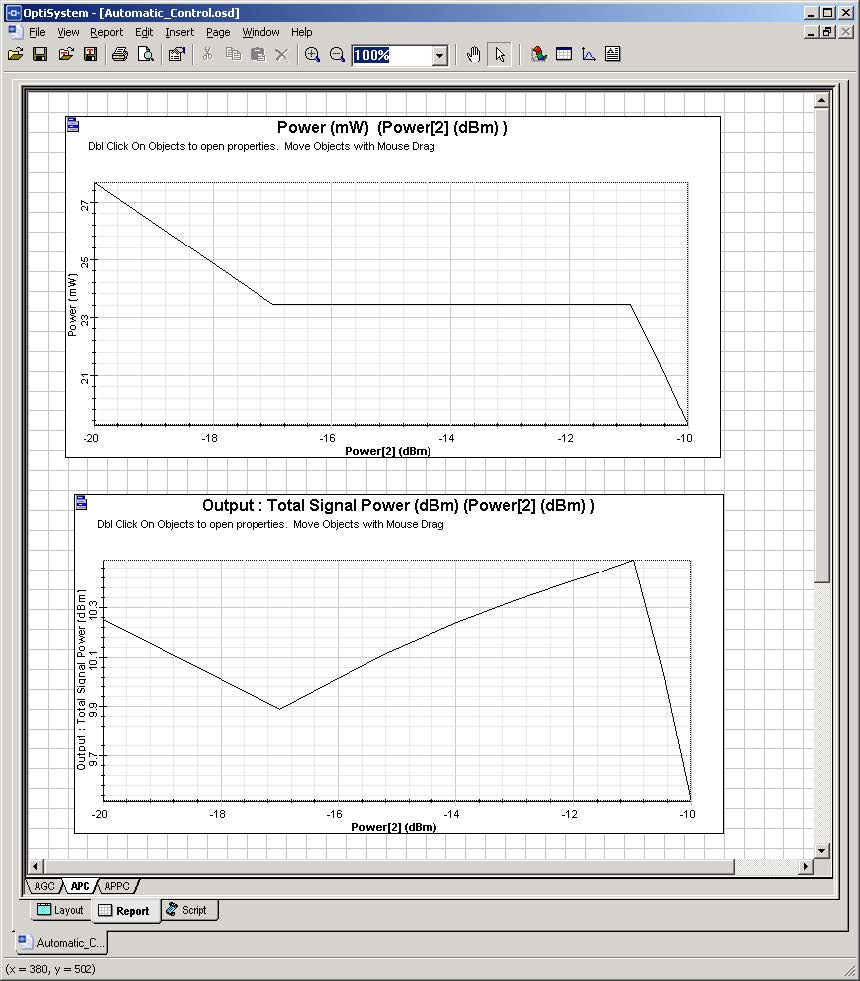
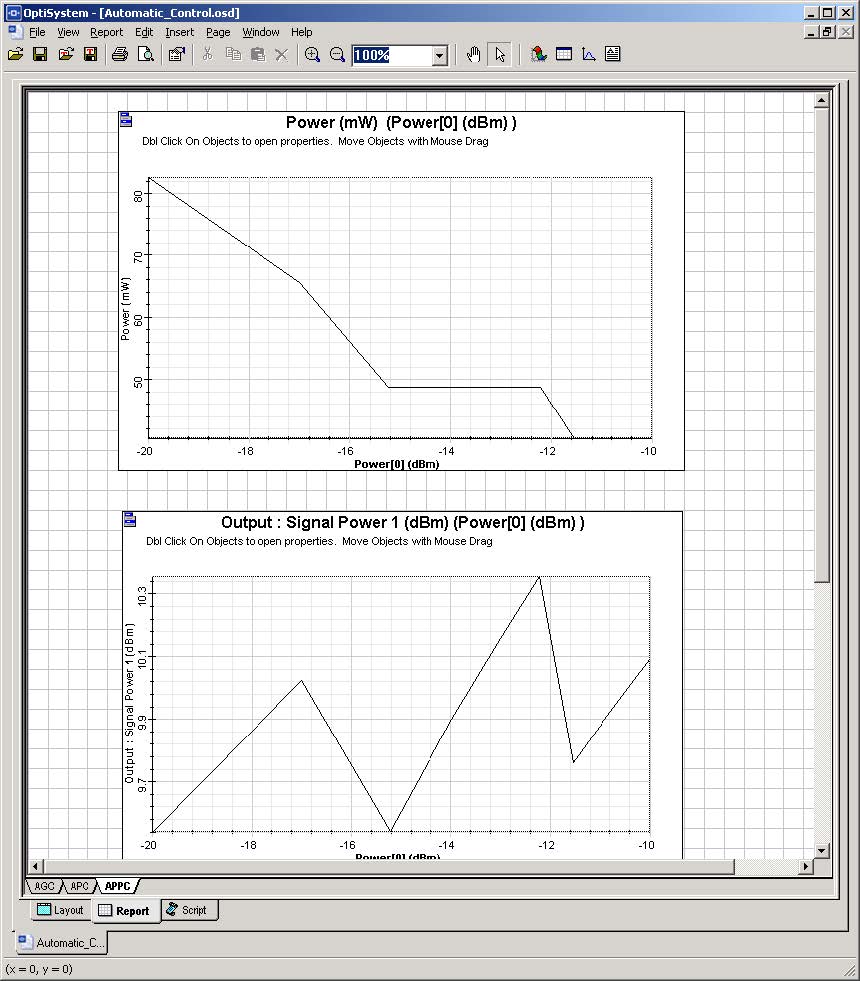
- Select the tabs AGC, APC or APPC to see the results.
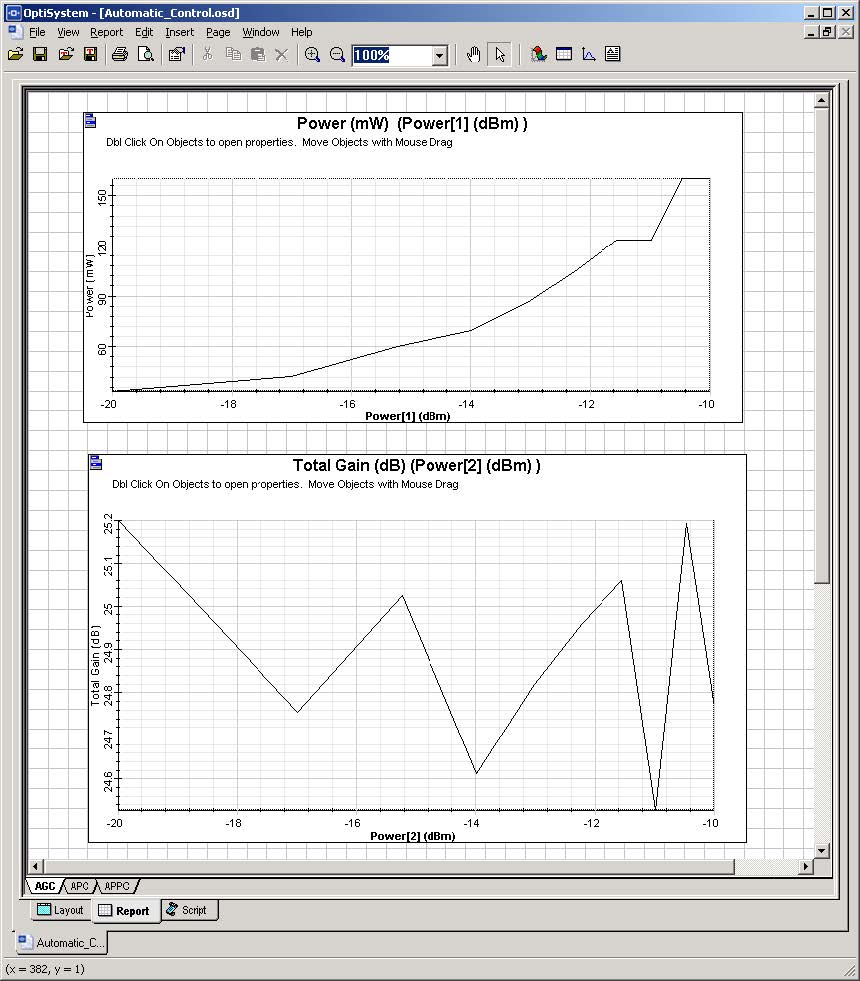
Observe the pump power and gain graphs for the AGC amplifier (Figure 4).
The total signal power for the APC amplifier (Figure 5) and the signal power for the APPC amplifier (Figure 6).
The AGC provides a constant gain of 25 dB, the APC provides a constant output power of 10 dBm and the APPC a constant power of 10 dBm at 1530 nm.
Figure 4: AGC amplifier, pump power and gain
Figure 5: APC amplifier, pump and signal power
Figure 6: APPC amplifier, pump and signal channel power


