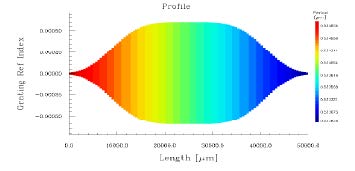
In this lesson, you will use the Fiber Bragg Grating example from Lesson 1. Have a
look at the Profile graph.
| Step 1 | |
| In this step, you will learn to define Sensor characteristics. |
To define Sensor characteristics
| 1 | Select Grating from the Parameters menu, or simply select the Grating icon on the left. |
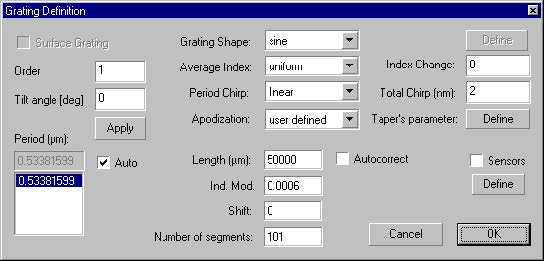
| 2 | In the Grating Manager dialog box, double-click the selected grating to open the Grating Definition dialog box. |
| 3 | In the Grating Definition dialog box, enable the Sensors check box. |
| 4 | 4 Click the Define button beneath the Sensors check box. |
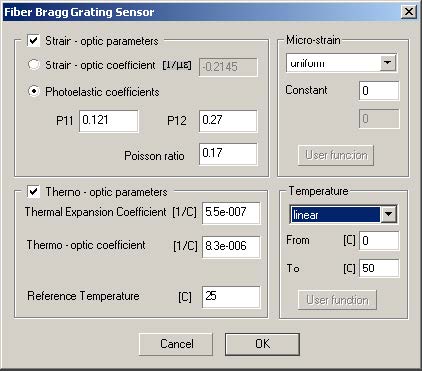
| 5 | In the Fiber Bragg Grating Sensor dialog box, in the Temperature section, select Linear from the list box. |
| 6 | Make sure the value in the From box is set to the default value, 0 degree Celsius. |
| 7 | Make sure the value in the To box is set to the default value, 50 degree Celsius. |
| 8 | Click the OK button to close the Fiber Bragg Grating Sensor dialog box, click the OK button to close the Grating Definition dialog box, and click the OK button to close the Grating Manager. |
| 9 | Select the Profile tab from the window. |
| 10 | Click the Calculate button. |
| 11 | The spectrum for the specified temperature distribution will be calculated. Note that changing the distribution will change the spectrum. |


