
Table dialog box
The “Table” dialog box allows you to inspect and export numerical data related to plots
in the “Views” window.
To access this dialog box, do the following steps:
| Step | Action |
| 1 | Select one of the tabs in the output “Views” window |
| 2 | Select “Table” on the “Tools” menu |
 The elements and controls of the “Table” dialog box options are described below.
Numerical Data
The first column lists the current scan parameter, for example the wavelength. The
subsequent columns display numerical values of curves in the current plot.
Data Export
You can save any of the listed curves to a file.
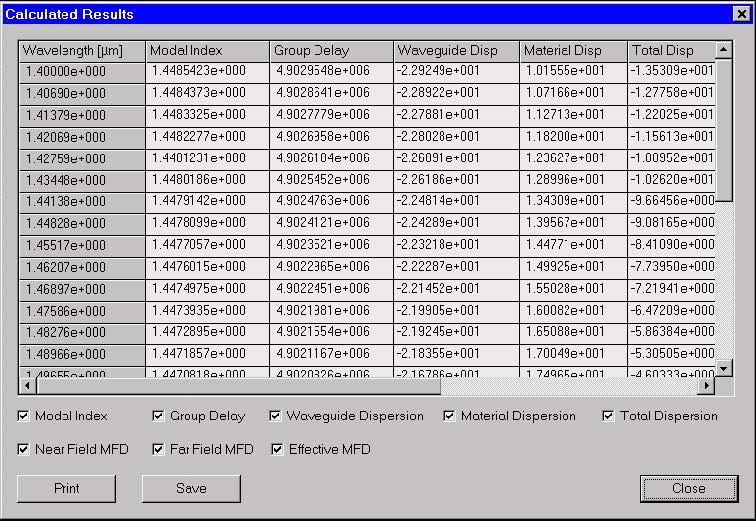
Calculated results dialog box
The “Calculated results” opens the “Calculated results” dialog box, where you can
preview, copy (for pasting in another application, such as Excel) or export to a text file
the numerical values that correspond to the last calculation.
 The elements and controls of the “Calculated results” dialog box options are
described below.
Check boxes
The different calculated results will be added to this dialog box if it is checked.
The following check boxes are available:
- Modal Index
- Group Delay
- Waveguide Dispersion
- Material Dispersion
- Total Dispersion
- Near Field MFD
- Far Field MFD
Save result
Press the “Save” button to save the data shown in this dialog box.
Print result
Press the “Print” button to print the data shown in this dialog box.
Graphic Properties dialog box
This dialog box allows you to tweak the details of the active display view. It is
accessible through the context menu “Tools” activated by the right button of the
mouse.
To access the graphic properties dialog box, do the following steps:
| Step | Action |
| 1 | Go to one of the tabs in “Views” window |
| 2 | Click the right mouse button to activate the floating “Tools” menu |
| 3 | From the “Tools” menu, select “Graph Properties” |
The dialog looks and functions differently depending on the type of graphic. For all the
2D view tabs it looks as shown:
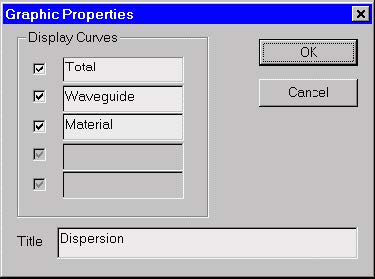 The user can select/deselect each curve for displaying and can enter the graph title.
If the active view is the topological “Mode Field” view, then the “Graph Properties”
dialog box looks as shown:
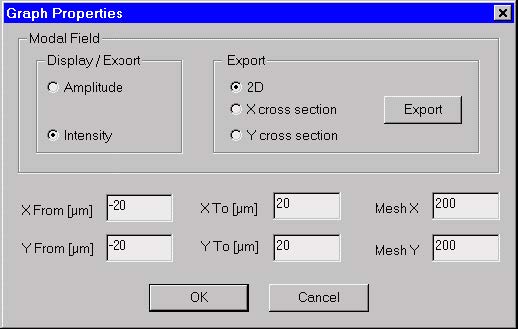 Its elements and controls are described below.
Display / Export
This option allows the user to select what how to view and/or export the modal field:
as amplitude or as intensity.
Export
Determines what characteristic of the modal field to export:
- The topological pattern of the mode. The exported file has a real 3D file Format: BCF3DPC (please, see the “Supported File Formats” description at the end of the “Technical Background”).
- The current X-cut 2D graph. The exported file has is a simple text file starting with a header indicating the Y position of the X-cut and having two columns:
- 1st column – X position,
- 2nd column – amplitude or intensity
- The current Y-cut 2D graph. The file format is the same as in the X-cut case, with the meaning of Xand Y- alternatively interchanged.
The currently selected option in “Display / Export” determines whether intensity or
amplitude will be exported.
Press the ”Export” button to perform the actual file saving.
Modal Field window Parameters
You can specify the modal field window limits by entering values for “X From”, “X To”,
“Y From”, “Y To”. “Mesh X” and “Mesh Y” are the sampling points in X and Y directions
and determine the resolution.