Silicon subwavelength gratings on quartz substrates can function as a color filter. This has been shown the following published paper:
[1] Yoshiaki Kanamori, Masaya Shimono, and Kazuhiro Hane, “Fabrication of Transmission Color Filters Using Silicon Subwavelength Gratings on Quartz Substrates”, IEEE PHOTONICS TECHNOLOGY LETTERS, VOL. 18, NO. 20, OCTOBER, 2006, pp. 2126-.
The layout sketch taken from the above reference is shown in Figure 6. The published reference paper also shows the measurement results and the simulation results with RCWA method. For such a periodic grating with normal incident wave, OptiFDTD simulation can only pick up one unit cell with the transverse boundary set as the periodic boundary condition and input transverse beam pattern is set as rectangular wave (plane wave). The corresponding project file can be found in the Sample file folder, the file is named as:
“X64_sample55_2D_Silicon_Subwavelength_Grating.fdt”
Figure 6: Silicon Subwavelength Gratings [1]
Please open this layout with OptiFDTD layout designer. Double clicking on each object in the layout to check the settings:
• The layout 2D wafer width (x-direction domain width) is set as 0.4µm, which is the red color filter grating’s periodic length.
• The groves material is silicon which uses the Lorentz_Drude model
• Time domain input wave is Gaussian Modulated Continuous Wave (GMCW); the center wavelength is set as 0.55µm. Right click on the input spectrum graph and select the zoom in tool to enlarge the spectrum region, the bandwidth can be found covers 0.4um to 0.8um.
• Transverse input beam pattern is set as rectangular wave with size larger than the x-direction domain size. This makes the input beam works as a truncate plane wave.
• The x-direction boundary condition is set as periodic boundary condition (PBC). This can be found by clicking the advanced button in the Simulate 2D using 64bit simulator dialog box.
• The spectrum wavelength range is set as from 0.4 µm to 0.8 µm with sampling point as 161. This can be found by click the DFT Spectrum button in the Simulate 2D using 64bit simulator dialog box
• One observation line is put after the grating, it detects the transmission spectrum. Another observation line is put behind the input plane, it detects the reflection spectrum.
Please perform the 2D 64bit simulation for this sample layout (32bit simulation is also
OK but will be slow). After the simulation, open the results file to get the transmission
spectrum and reflection spectrum.
| Step | Action |
| 1 | Under tools menu, select Observation Area Analysis |
| 2 | Select Observation Line in Observation Area Analysis dialog box. |
| 3 | Select “Observationline1” in the observation line check list |
| 4 | Select Power Spectrum button, Power Spectrum dialog box appears |
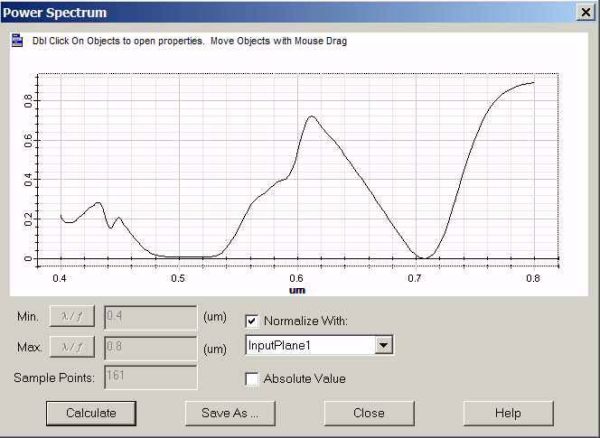
| 5 | Check “normalize with” checkbox and click Calculate button, Power Transmission spectrum appears, (refer to Figure 7). Power transmission spectrum matched the measurement results published in the referenced (refer to Figure 8) |
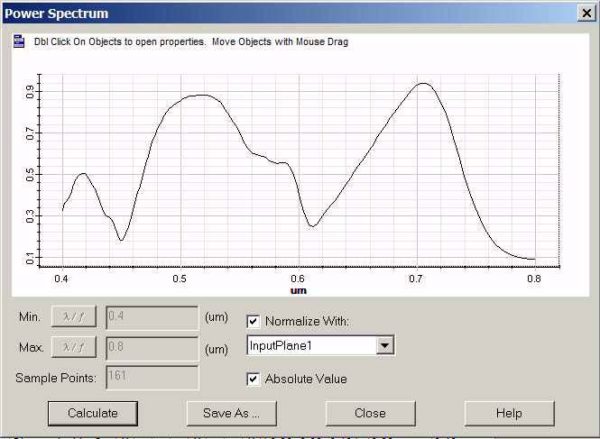
| 6 | Repeat step 3 to 4 for Observationline2, reflection spectrum can be calculated, (refer to Figure 9). |
Figure 7: Transmission spectrum obtained by OptiFDTD
Figure 8: Transmission spectrum in reference [1]
Figure 9: Reflection spectrum obtained from OptiFDTD


![FDTD - Figure 8 Transmission spectrum in reference [1] FDTD - Figure 8 Transmission spectrum in reference [1]](https://optiwave.com/wp-content/uploads/2023/05/FDTD-Transmission-spectrum-in-reference-1.jpg)
