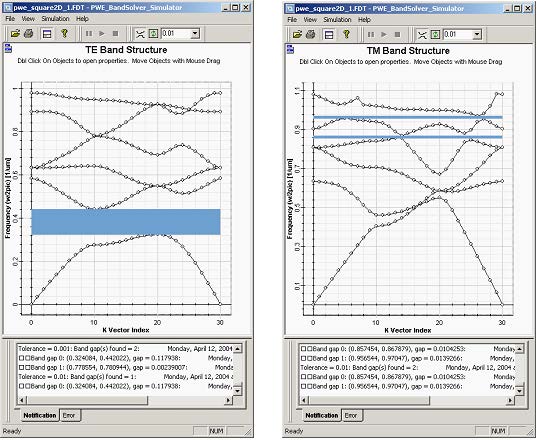
When finished with editing band solver parameters click Run… to start the simulations. A simulation windows will be launched and simulation starts. You will be notified in the Notification tab window at the bottom about progress of the simulations. The engine first reports on the permittivity averaging process, then on the progress of calculations for individual k-vectors and finally informs you when the simulation is finished. At the end of the simulation the graph is populated with set of eigenfrequencies of individual k-vectors. You can use the ‘Connect’ button on the Diagram toolbar to connect the eigenfrequencies of individual bands as in the 1D case. You can also identify band gaps if there are any. To get band structure for TM modes you have to run the simulation again with TM polarization setting.
It is always possible to run with hybrid polarization setting. In this case both TE and TM modes are displayed but the band solver cannot distinguish the modes.
Figure 2: Band Diagram from PWE Band Solver
You can compare the calculated band diagrams with the results in reference [1].


