| Step | Action |
| 1 | Click on “3D_Ref_Idx-Re(y)” tab on the bottom of the layout frame or select “Refractive Index” in the View menu. View of the refractive index cross-cut slice appears. |
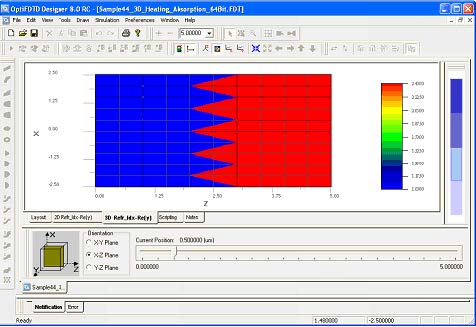
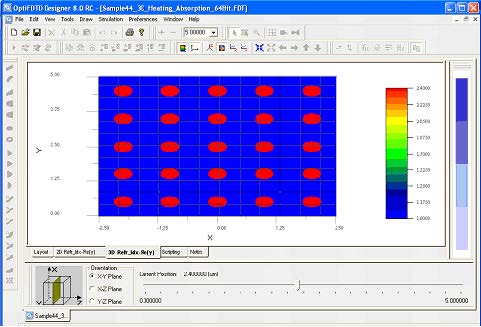
| 2 | In the Orientation region which is in the left-bottom area of the window, change the slice orientation and move the slice position to observe the index distribution (refer to Figure 5, and Figure 6)
• Select Height Plot shortcut toolbar to observe the refractive index in height plot format. • Right click on OptiFDTD graph to display the available graph tools/menus. |
Figure 5: Refractive index distribution in xz plane at y=0.5
Figure 6: Refractive index distribution in xy plane at z=2.4


