Observation point, Line, area, are the post-simulation detector. Field pattern, transmission function and reflection function (versus wavelength) can be obtained with these detectors:
- Observation Point—Observe the time domain and frequency domain response. The transmission function can be obtained from the Observation Point analysis If the point detector is put in the waveguide center where the peak value happens.
- Observation Area— Observe the field pattern for a give wavelength. compute power transmission ratio, and normalized power versus wavelength. When Observation area is put at the transmitted area, the power transmission function can be obtained. When Observation area is put at reflection area (beyond the input plane), reflection function can be obtained. 32bit simulation will record all the time domain response in the Observation area, user can specify any wavelength to perform the DFT spectrum analysis in analyzer. 64bit simulation performs the spectrum analysis, no time domain response is recorded. Spectrum results for user pre-defined wavelength will be save to analyzer. User can select the wavelength form the list to check the corresponding spectral results in observation area analysis. To Pre-define the wavelength range for 64bit simulation, please click the Spectrum button in the 64bit simulation parameters dialog box.
- Observation Line—Only available for a 2D simulation. Observe the frequency domain response, compute power, and normalized power versus wavelength.
Setting up an Observation Point
| Step | Action |
| 1 | From the Draw menu, select Observation Point. |
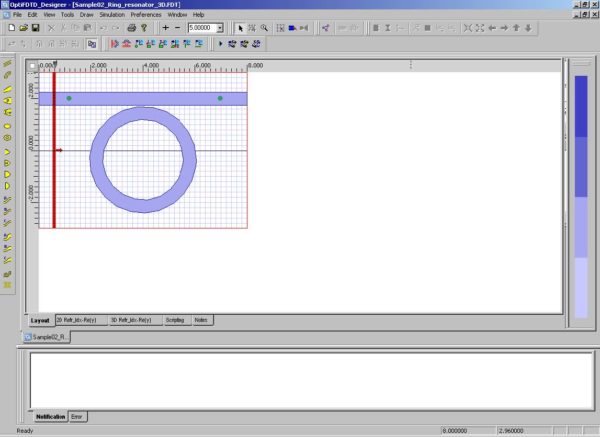
| 2 | Click in the layout window where you want to place the Observation Points. |
Figure 32: Observation Points
| 3 | Double-click the first observation point.
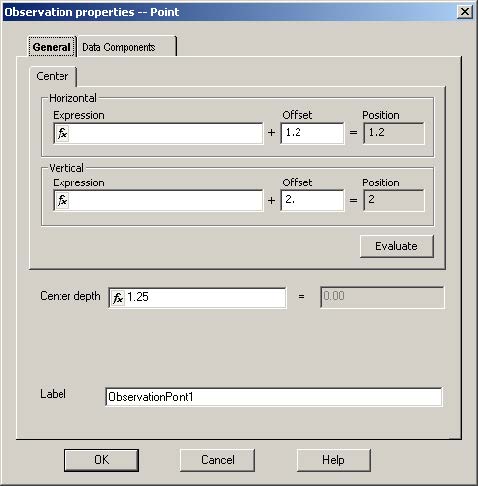
The Observation properties — Point dialog box appears. |
Figure 33: Observation properties — Point dialog box
| 4 |
To adjust the position of the observation point, click the General tab and type the following: Horizontal Offset (µm): 1.2 Vertical Offset (µm): 2.0 Center depth (µm): 1.25 Label: ObservationPoint1 (default) |
| 5 | To select the field components, click the Data Components tab. |
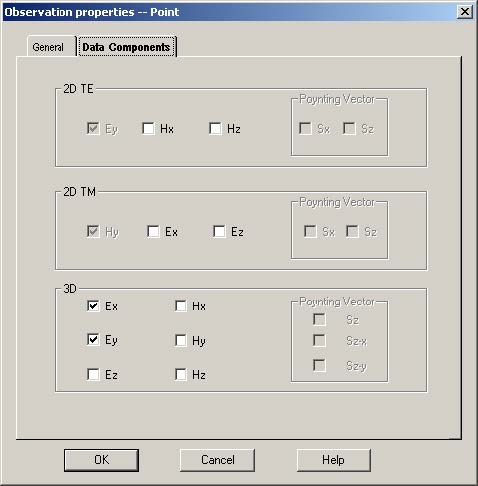 Figure 34: Data Components tab
| a. Under 3D, select the Ex check box.
b. Under 3D, select the Ey check box. |
|
| 6 | Repeat steps 3 to 5 for the second observation point, using the following values:
Horizontal Offset (µm): 7.0 Vertical Offset (µm): 2.0 Center depth (µm): 1.25 Label: ObservationPoint2 (default) Data Components: i. Under 3D, select the Ex check box. ii. Under 3D, select the Ey check box. |
Run the simulation
To run the simulation, perform the following procedures.
Note: When you run this simulation for the first time, it is recommended that you run the 2D simulation first. To run the 3D simulation based on this sample file may take up a lot of CPU resources. It is suggested that you use FDTD_Analyzer to open the corresponding results file that can be found on the set-up CD.
Setting up the simulation parameters
| Step | Action |
| 1 | From the Simulation menu, select 3D 32bit Simulation Parameters.
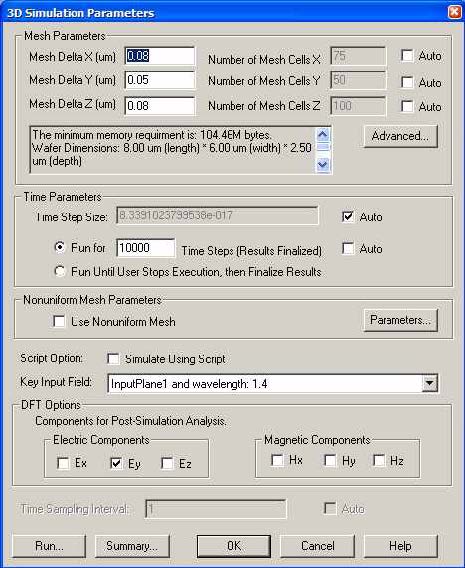
The 3D Simulation Parameters dialog box appears. |
Figure 35: 3D Simulation Parameters dialog box
| 2 |
Type the following values for the mesh size: Mesh Delta X (µm): 0.08 Mesh Delta Y (µm): 0.05 Mesh Delta Z (µm): 0.08 Note: The total mesh number for each orientation will be calculated automatically, once focus is removed from the specific edit region. |
| 3 | To set up the boundary condition parameters, click Advanced.
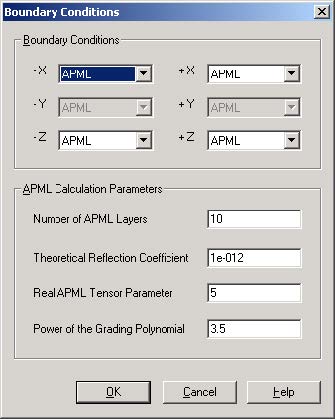
The Boundary Conditions dialog box appears. |
Figure 36: Boundary Conditions dialog box
| 4 | Type the following values for the boundary condition:
Number of APML Layers: 15 Theoretical Reflection Coefficient: 1.0e-12 Real Anisotropic PML Tensor Parameter: 1.0 Power of grading Polynomial: 3.5 Note: – Un-split Perfectly Matched Layer (UPML) was used for the boundary condition in this software. For more information, refer to the OptiFDTD Tutorials and Technical Background. – The default setting for UPML parameters in OptiFDTD ensures that the outgoing waves are absorbed properly. We recommend that you use the default setting unless you are familiar with UPML boundary conditions. |
| 5 | To save the boundary condition setting, click OK. |
| 6 | Under Time Parameters, perform the following:
a. Check Auto box to get the time step size. b. Type the number of time steps to run: 10000. Note: The time step value is calculated from the minimum mesh size. |
Figure 37: Time Parameters
| 7 | From the Key Input Field drop-down list, select Input Plane1 and wavelength 1.4.
Note: – Key input selection is used to obtain the wavelength for DFT calculation in the simulation. |
Figure 38: Key Input Field
| 8 | Under DFT Options, select the DFT components that you want to simulate. |
Figure 39: DFT Options
| 9 | Select Ey check box.
Note: – The discretized Fourier transform (DFT) will run for the selected field components for the key input wavelength in the simulator. – The DFT results will be saved for performing post simulation analyses, such as Far Field Pattern, Mode Overlap Integral calculation, Input Overlap Integral calculation, and observation of the frequency domain field pattern. |
| 10 | To start 3D 32bit simulation, click Run in the simulation dialog box.
Note: 64bit simulation on multiple core system will be much faster than 32bit simulation. To perform the 64bit simulation, please read the chapter “know the difference between 32bit simulation and 64bit simulation” or tutorial lesson 18 |
Running the 32bit simulation
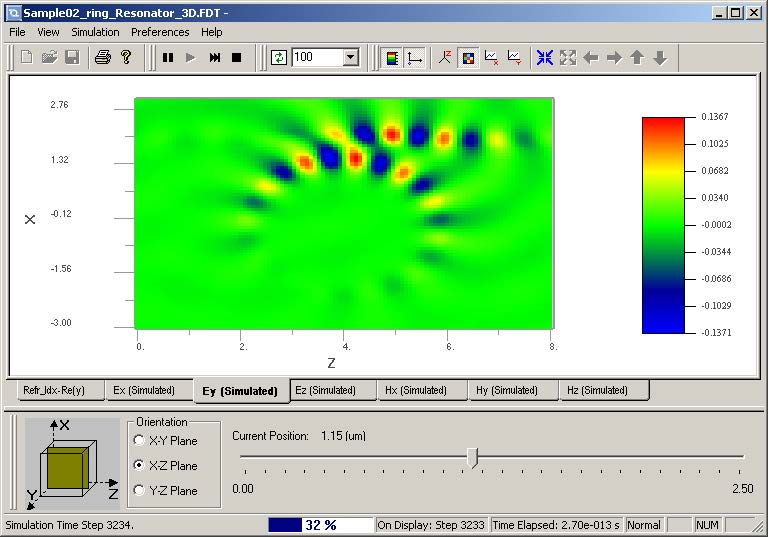
OptiFDTD_Simulator is a separate window that displays the simulation as it runs.
| Step | Action |
| 1 | To observe the simulated field components in one slice, perform one of the following: |
Figure 40: 3D Simulation results
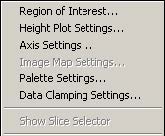
| – From the View menu, select 3D Graph Items, and then select the type of view that you want (for example, Height Plot, Image Map, or Plane View).– To open the a context menu listing the 3D Graph Items, right-click anywhere in the graph. |
Figure 41: 3D Graph Items list
| – Select the field components and refractive index that you want to view by clicking the corresponding tab. |
Figure 42: Component tabs
| – To specify the slice orientation and the position, move the Slice Chooser slider to the desired value. |
Figure 43: Slice Chooser
| – To specify the step interval number for updating the simulated field data, select a new value from the View Update list. |
Figure 44: View Update list
| 2 | To pause, resume, stop and finalize the simulation, from the Simulation menu, select the action you want to perform
OR Click the corresponding button on the Simulation toolbar. |
Figure 45: Simulation toolbar
| 3 | To view the observation point in the simulator, from the View menu, select Observation Points.
The Observation Area Analysis dialog box appears. |
Figure 46: Observation Area Analysis dialog box
| 4 | To observe the time domain response on a single point, select the following:
– field components – observation point – time |
| 5 | To observe the frequency domain response on a single point, select the
following: – field components – observation point – Frequency FFT |
| 6 | To change the x-axis to frequency or wavelength, click Frequency/Wavelength. |
Analyze the simulation results
In this lesson, you have created a design, run a simulation, and loaded the corresponding simulation results file into OptiFDTD_Analyzer. The following analysis is based on this sample.
OptiFDTD_Analyzer displays the simulation results and allows you to perform a post- simulation analysis. To analyze the simulation results, perform the following procedures.
Note: If you do not use the simulation results file sample you created, the OptiFDTD software CD has the results file available. Copy it and open the file using the OptiFDTD_Analyzer.
Opening OptiFDTD_Analyzer
OptiFDTD_Analyzer can be opened in one of two ways.
From OptiFDTD_Simulator
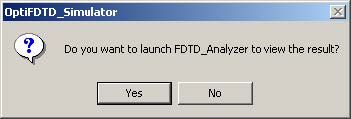
When the simulation ends, a message appears and prompts you to open
OptiFDTD_Analyzer.
Figure 47: Message box
| Action | |
Note: When the simulation ends in OptiFDTD_Simulator, the results are saved automatically as a file with same name, but with a different file extension (*.fda). |
From the Start menu
| Step | Action |
| 1 | From the Start menu, select Programs > Optiwave Software > OptiFDTD > Results Analyzer. OptiFDTD_Analyzer opens. |
Figure 48: OptiFDTD_Analyzer
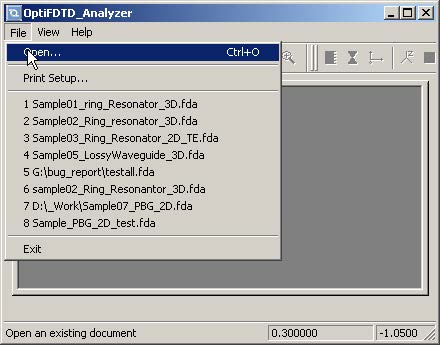
| 2 | To open an existing simulation results file (*.fda), from the File menu, select Open. |
Figure 49: File menu
Analyzing the results
| Step | Action |
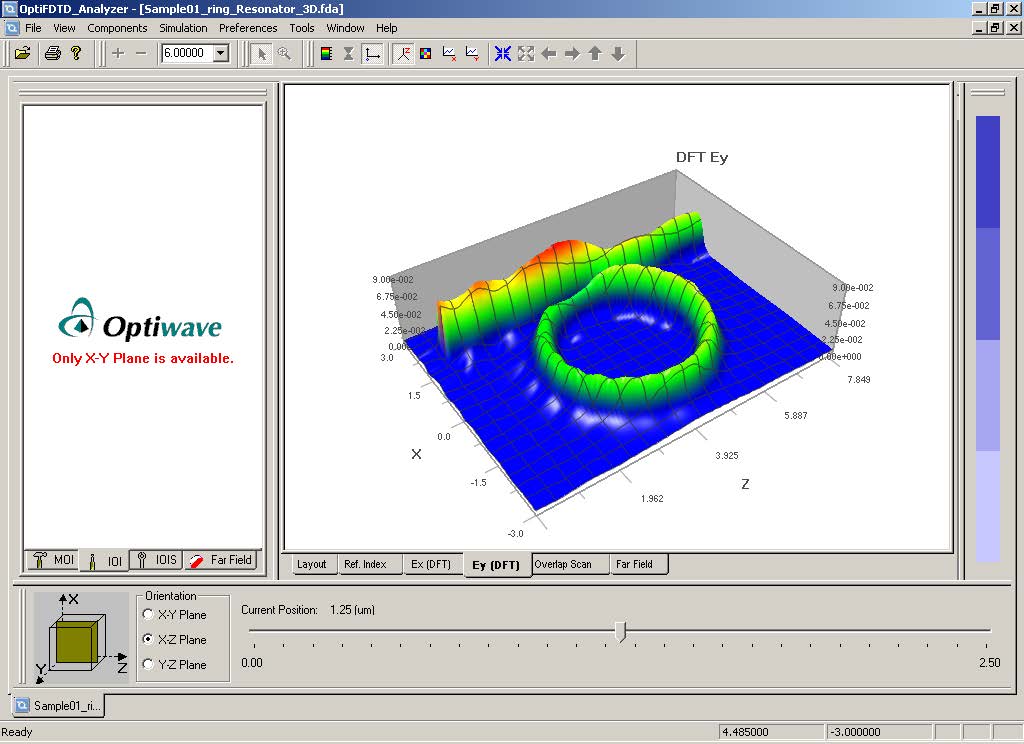
| 1 | View the field distribution (after the DFT results) for the center (carrier) wavelength. |
Figure 50: Field distribution
| Note:
– You can specify the orientation and the observation plane position. – You can only view the simulation results and the Poynting Vector for the components that you selected for DFT calculation in the 3D Simulation Parameters dialog box. Note: Proceed to the next step if the required components have been selected in the layout for the Power calculations. |
|
| 2 | Calculate and observe the Power value and the Normalized Power value (to the input plane) for the current slice position.
Note: – The power calculation is available only if related components are selected in the 3D Simulation Parameters dialog box. – The power types for each slice are power in two-direction polarization and the total power. |
Calculating the Mode Overlap Integral (MOI)
You can perform the Mode Overlap Integral (MOI) calculation on the X-Y plane only.
| Step | Action |
| 1 | Under Orientation on the Slice Chooser, select X-Y Plane. |
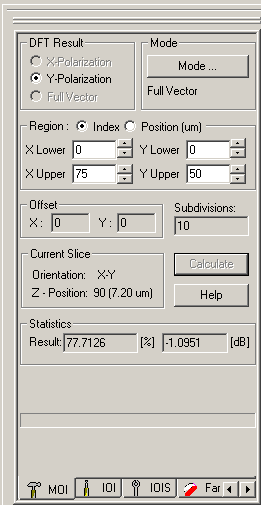
| 2 | Move the slider position to 7.2µm. |
Figure 51: Slice Chooser
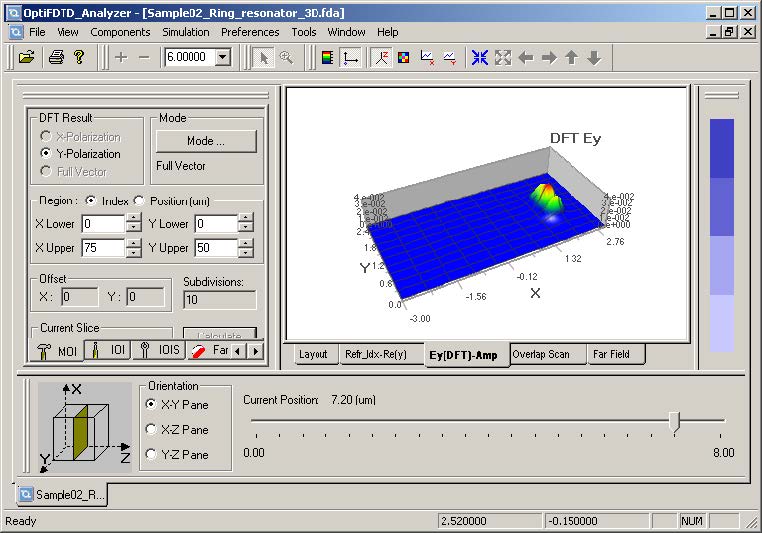
| 3 | In the Analysis Tools window, click the MOI tab.
The MOI tab appears. |
Figure 52: MOI tab
| 4 | Type or select the following information:
DFT Result: Y-Polarization Region: Index X Lower: 0 X Upper: 75 Y Lower: 0 Y Upper: 50 Offset: 0 Note: The default parameters are for the entire slice region. |
| 5 | To find the mode on the current slice, click Mode.
When the mode solver finds a mode, the Calculate button becomes available. Note: Ensure that the mode solving in this step has the same conditions are as the ones you used when you solved the mode for the Input Plane. Refer to Steps 13, 14, and 15. |
| 6 | To perform the MOI calculation, click Calculate.
The results appear under Statistics in the Result field. |
Figure 53: MOI calculation results
Calculating the Input Overlap Integral (IOI)
- Compare the simulated output and the input
| Step | Action |
| 1 | Under Orientation on the Slice Chooser, select X-Y Plane. |
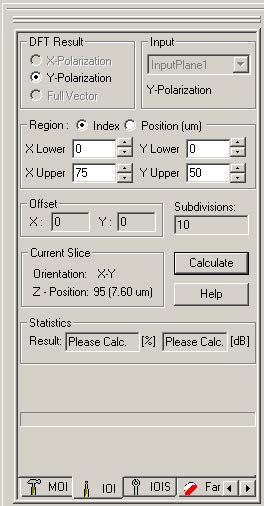
| 2 | Move the slider position to 7.6µm |
| 3 | In the Analysis Tools window, click the IOI tab.
The IOI tab appears. |
Figure 54: IOI tab
| Note: Use the default settings for the IOI calculation parameters. | |
| 4 | To perform the IOI calculation, click Calculate.
The results appear in Statistics in the Results field. |
Figure 55: IOI calculation results
Calculating the Input Overlap Integral Scanner (IOIS)
- Compare the input field and the output field at each X-Y slice.
- Power transmission ratio to the input wave at z-direction
| Step | Action |
| 1 | Under Orientation in the Slice Chooser, select X-Y Plane. |
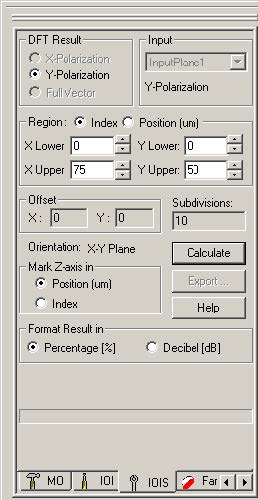
| 2 | In the Analysis Tools window, click the IOIS tab.
The IOIS tab appears. |
Figure 56: IOIS tab
| Note: Use the default settings for the IOIS calculation parameters. | |
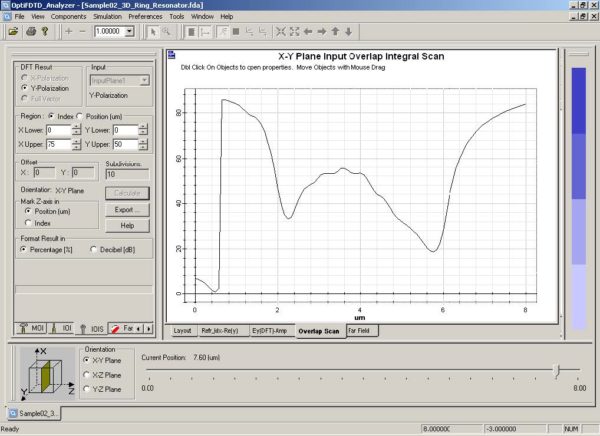
| 3 | To perform the IOIS calculation, click Calculate.
The results graph appears in the Overlap Scan window. |
Figure 57: IOIS calculation results
| Note: – The IOIS calculation goes through the entire Z-direction. |
Calculating the Far Field Transform
| Step | Action |
| 1 | Under Orientation on the Slice Chooser, select X-Y Plane. |
| 2 | Move the slider position to 7.6µm |
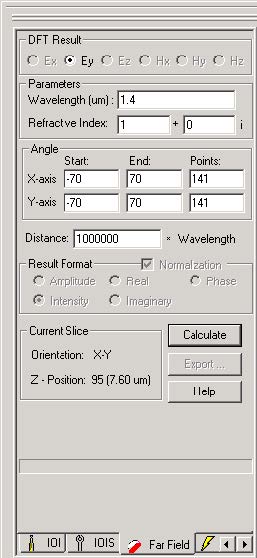
| 3 | In the Analysis Tools window, click the Far Field tab.
The Far Field tab appears. |
Figure 58: Far Field tab
| Note: You can select DFT components at any slice to perform the far field calculation. |
|
| 4 | Select the following information:
DFT Result: Ey Wavelength: 1.4µm Refractive Index: 1 X-axis Start angle: -70 X-axis End angle: 70 X-axis Points angle: 141 Y-axis Start angle: –70 Y-axis End angle: 70 Y-axis Points angle: 141 |
| 5 | To perform the far field transform, click Calculate. |
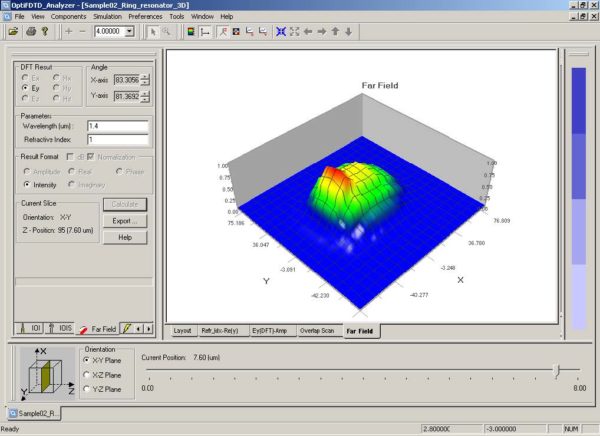
| 6 | To view the far field distribution, click the Far Field tab at the bottom of the layout window. |
Figure 59: Far field calculation result
| 7 | To save the Far Field Transform results, in the Analysis Tools window, click Export. |
Performing the Observation Object Analysis
| Step | Action |
| 1 | From the Tools menu, select Observation Area Analysis.
The Observation Area Analysis dialog box appears . |
Figure 60: Observation Area Analysis dialog box
| 2 | Click the Observation Point tab to perform the observation point analysis.
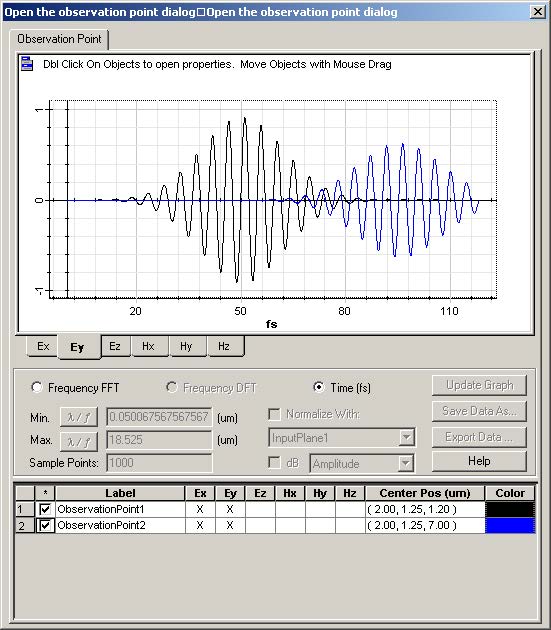
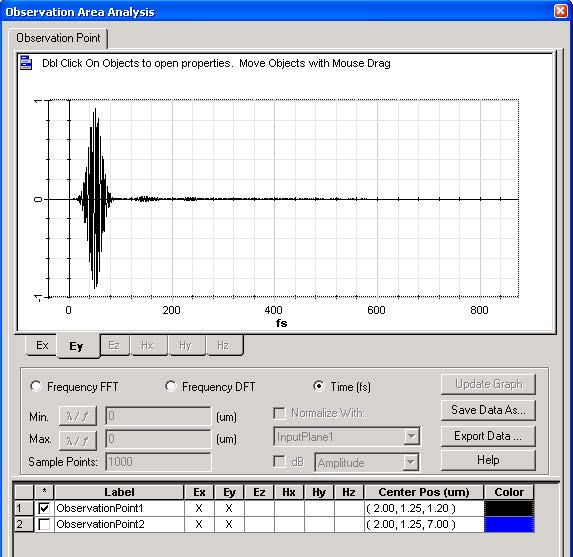
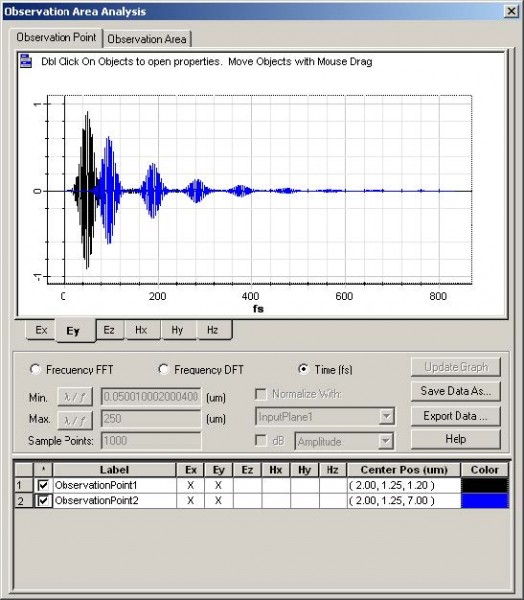
a. To view the Time Domain Response: i. Click Time (fs). ii. Under Label, select the check box for the observation point or points that you want to view. iii. Select the tab under the graph for the field component that you want to view. |
Figure 61: Observation Point analysis—Time Domain Response
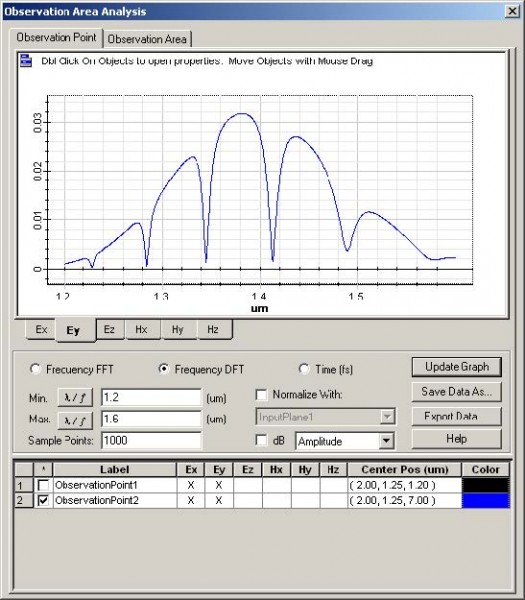
| b. To view the Frequency Domain Response:
i. Click Frequency DFT. ii. Under Label, select ObservationPoint2. iii. Select the field component Ey. iv. Set the wavelength/frequency range and the sampling point number. Minimum wavelength: 1.2µm Maximum wavelength: 1.6µm Sampling point: 1000 v. Click Update Graph to view the graph. vi. To set the X-axis units, click Wavelength/Frequency. |
Figure 62: Observation Point analysis—Frequency Domain Response
| Note: You can specify the type of curve—amplitude, phase, real part, Imaginary part, or decibel. |
|
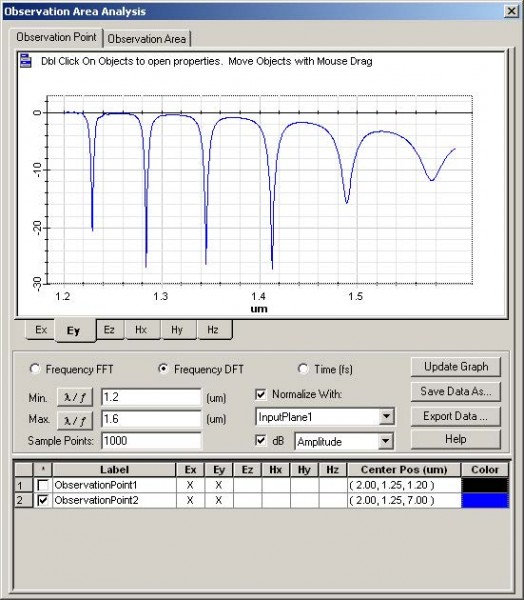
| c. To calculate the transmission/normalized response:
i. Click Frequency DFT. ii. Under Label, select ObservationPoint2. iii. Select the field component Ey. iv. Set the wavelength/frequency range and the sampling point number. Minimum wavelength: 1.2µm Maximum wavelength: 1.6µm Sampling point: 1000 v. Select Normalized with. vi. In the Input plane list, select Input Plane1. vii. Select dB to view the transmission function. viii. Click Update Graph to view the graph. |
Figure 63: Observation Point Analysis—Normalized response
Export results
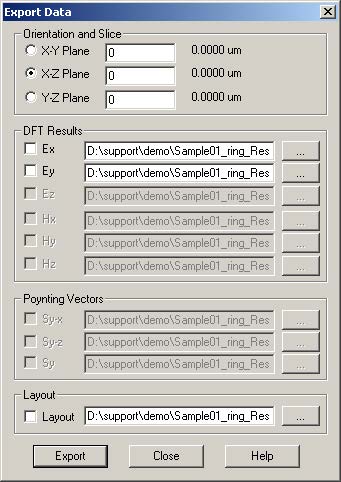
You can export the DFT results, refractive index, Poynting Vector, and layout in the
desired slice from OptiFDTD_Analyzer to a location that you choose.
Exporting results
| Step | Action |
| 1 | From the File menu, select Export.
The Export Data dialog box appears. |
Figure 64: Export results
| 2 | Select the results that you want to export, and click Export. |


