OptiFDTD contains more features in the Input Wave set up and the simulation set up. The excitation set up for the simulation is done by the Input Plane which contain the following features:
Time Domain Input Wave formation
- Continuous Wave with single wavelength
- Pulse wave with broad band spectrum
Transverse field distribution
- Modal Input
- Gaussian beam
- Rectangular beam
- User defined Transverse
Polarization formation
- Linear polarization
- Circular Polarization
Input Wave direction
Power
Amplitude
The following procedures illustrate how to set up the input wave.
There is no specific layout used to show the input wave setup in this lesson. The text explanation and graphs are in general format only.
Note: This lesson presumes that you are familiar with the layout design and you use the sample lessons for reference.
Drawing an Input plane in the layout
To draw an input plane in the layout, perform the following procedure.
| Step | Action |
| 1 | From the Draw menu, select Vertical Input Plane. |
| 2 | Place the Input Plane in the layout at the desired position. A red line that presents the input plane appears in the layout window (see Figure 65). |
Figure 65: Vertical Input Plane
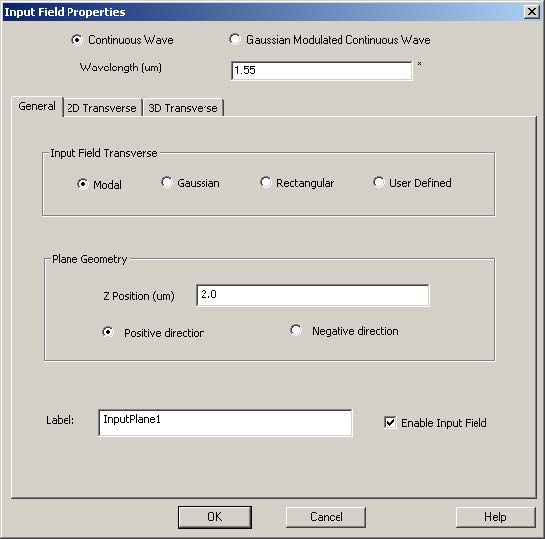
| 3 | To set up the input wave properties, double-click the red line (Input Plane). The Input Field Properties dialog box appears (see Figure 66). |
Figure 66: Input Field Properties dialog box
| 4 | In the Input Field Properties dialog box, set the Position and the desired wave propagation direction.
Note: For 2D simulations, a multiple input plane in vertical and horizontal position can be designed. |
| 5 | To select a Single Wavelength Input Wave:
a. Click Continuous Wave (CW). b. Type the wavelength value. |
| 6 | To select a Pulse Input—-Spectral Input Wave:
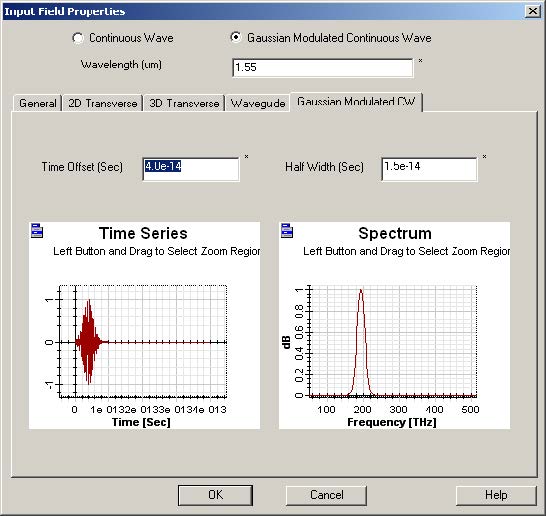
a. Click Gaussian Modulated Continuous Wave (GMCW). The Gaussian Modulated CW tab appears in the Input Field Properties dialog box (see Figure 67). |
Figure 67: Input Field Properties dialog box—Gaussian Modulated CW tab
| 7 | Type the center wavelength value in Wavelength box. |
| 8 | Click the Gaussian Modulated CW tab to edit the Pulse parameters.
Time domain and frequency domain input wave curves appear in the user interface (see Figure 68). Note: Right-click on the curve to use the graph tool to view or edit the graph (zoom in or out, for example). |
Figure 68: Time domain and frequency domain input wave curves
| 9 | Set the time offset and the half width of the input wave in time domain. This will adjust the spectrum width. |
| 10 | Right-click in the graph. The graph tool appears. |
| 11 | Select Zoom in the toolbar, and zoom into the region to see the detail of the time domain and frequency domain wave. |
Setting up the 3D Transverse Mode Input
| Step | Action |
| 1 | Click the General tab to return to the Transverse selection page |
| 2 | Click Modal. |
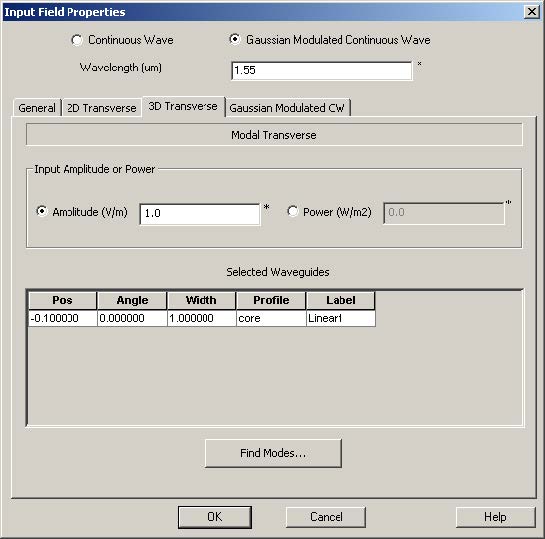
| 3 | Click the 3D Transverse tab to solve the 3D mode. The 3D modal transverse field summary page appears (see Figure 69). |
Figure 69: 3D Modal Transverse field summary
| 4 | Input power value or the amplitude of the input transverse mode. Note: Amplitude value will be the maximum value of the input electrical field. |
| 5 | Click Find Modes to solve the mode.
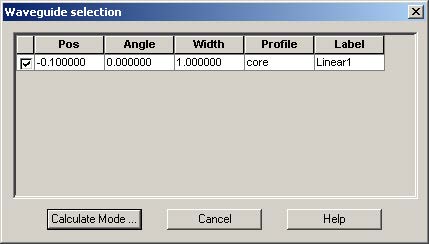
The Waveguide selection dialog box appears (see Figure 70). |
Figure 70: Waveguide selection dialog box
| 6 | In the Waveguide list, select a waveguide to solve the mode. |
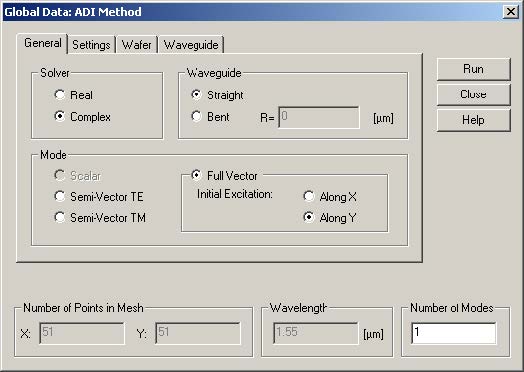
| 7 | Click Calculate Mode. The Global Data: ADI Method dialog box appears (see Figure 71). |
Figure 71: Global Data: ADI method dialog box
| 8 | In the Global Data: ADI Method dialog box, set up the mode solver parameters, as shown in Figure 71. |
| 9 | Click the Settings tab to set the initial guess field for solving the mode by ADI method.
Note: Three types of Boundary condition are available—Homogeneous, Neumann, and TBC. TBC is suggested. |
| 10 | Set the Accuracy and Acceleration parameters for controlling the mode solver. |
| 11 | Click the Wafer and Waveguide tabs to see the summaries of the wafer and waveguide properties. |
| 12 | Return to the Global Data: ADI Method dialog box. |
| 13 | Click Run.
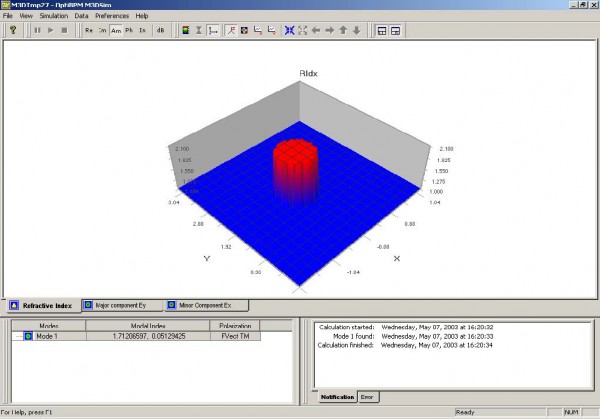
The Mode Solver interface appears (see Figure 72). |
Figure 72: Mode Solver interface—Refractive Index graph
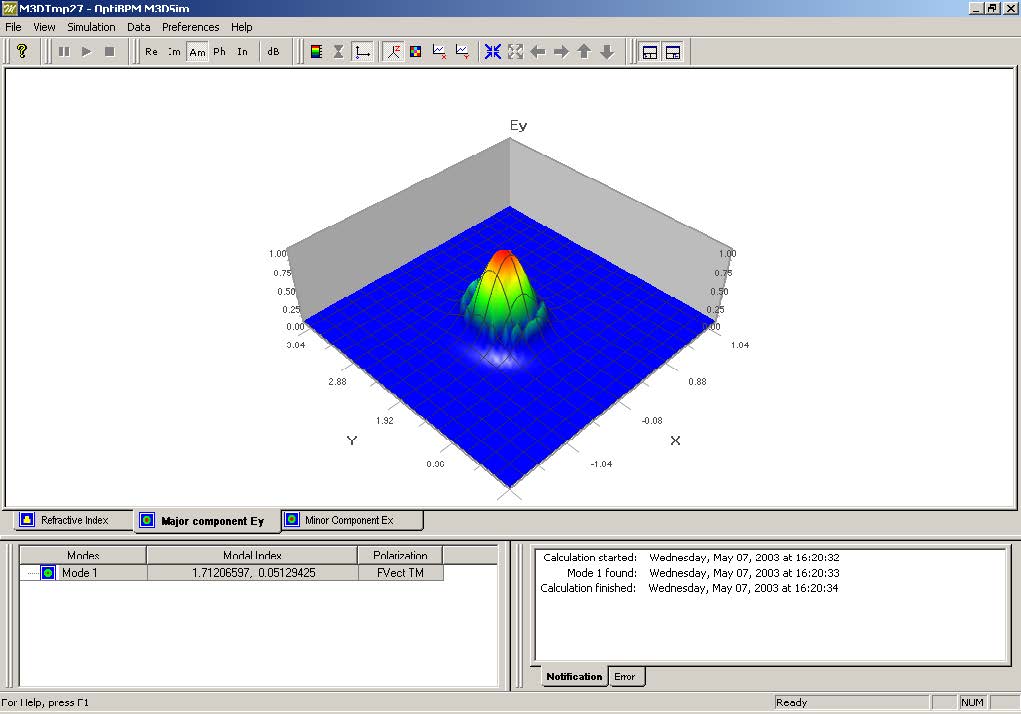
| When the Mode Solver finds the mode, results will be shown in the Mode solver as well as the Effective refractive index and transverse layout (see Figure 73). |
Figure 73: Major component Ey view
Setting up the 2D Transverse Mode Input
| Step | Action |
| 1 | Click the General tab in the Input Plane Properties dialog box. |
| 2 | Click Modal. |
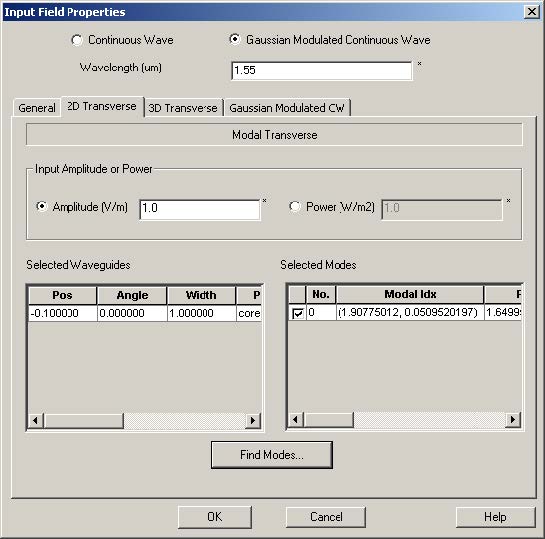
| 3 | Click the 2D Transverse tab to solve the 2D mode (see Figure 74). |
Figure 74: Input Plane Properties dialog box—2D Transverse tab
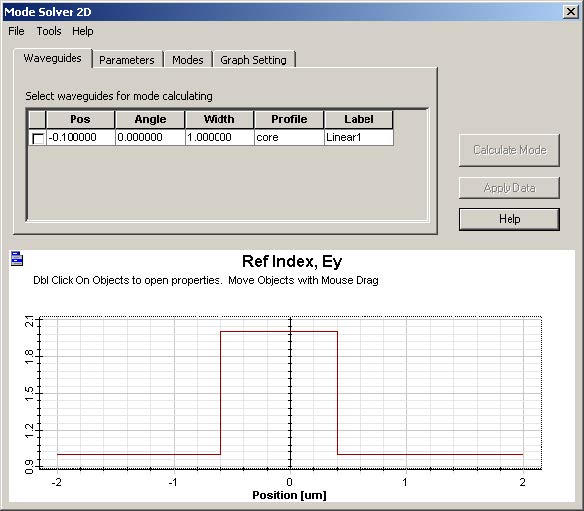
| 4 | Click Find Modes to set the 2D mode Solver. The Mode Solver 2D dialog box appears (see Figure 75). |
Figure 75: Mode Solver 2D dialog box
| 5 | Select the waveguides for Mode calculation. |
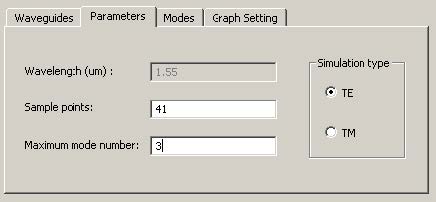
| 6 | Click the Parameters tab to edit the calculation parameters (see Figure 76).
– Set Sample points – Number of modes – TE or TM selection |
Figure 76: Parameters tab
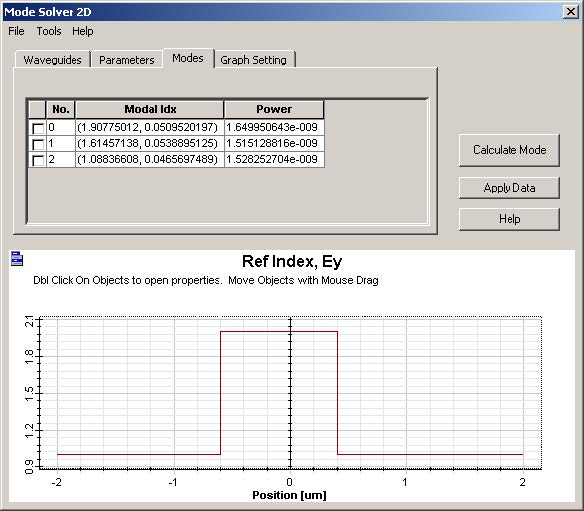
| 7 | Click Calculate Mode.
The calculation summary appears in the Mode Solver 2D dialog box (see Figure 77). |
Figure 77: Mode Solver 2D dialog box—Modes tab
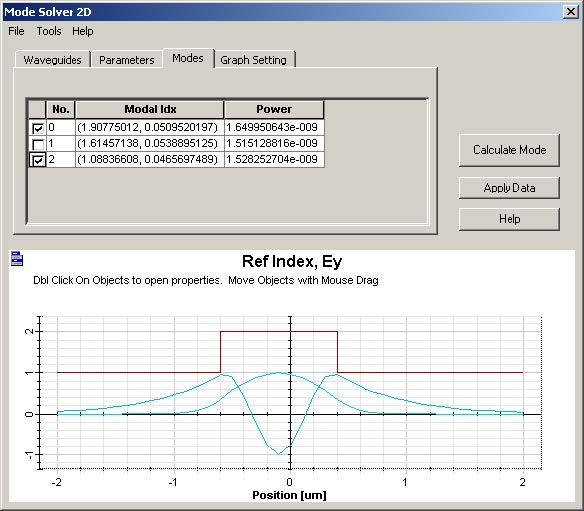
| 8 | From the mode list, select the mode. The mode distribution will be shown in the dialog box (see Figure 78). |
Figure 78: Mode Solver 2D dialog box
| 9 | Click Graph Setting to select the graph feature. |
| 10 | Select a mode and click Apply Data. This mode will be used as the 2D transverse input wave. |
Setting up the 3D Transverse Gaussian Beam Input
| Step | Action |
| 1 | Click the General tab in the Input Field Properties dialog box. |
| 2 | In the Input Field Transverse area, select Gaussian. |
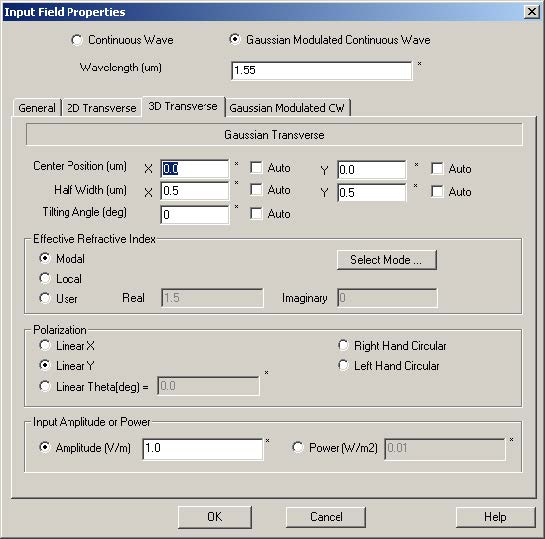
| 3 | Click the 3D Transverse tab.
The 3D Transverse tab appears (see Figure 79). |
Figure 79: 3D Transverse dialog box
| 4 | Define the Gaussian beam in the Gaussian Transverse region. |
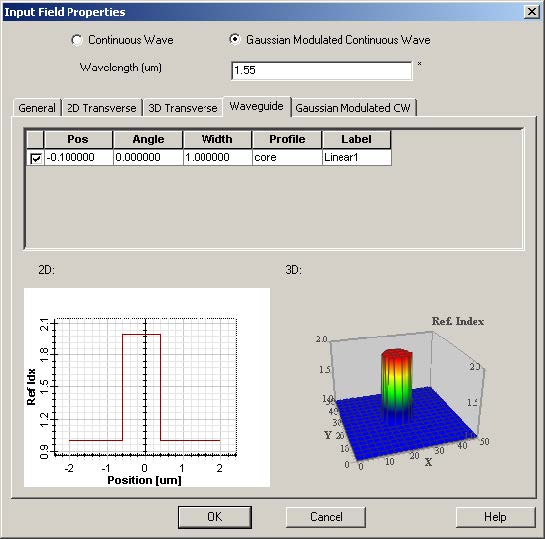
| 5 | Select the Auto check box. The Waveguide tab appears (see Figure 80). |
Figure 80: Waveguide tab
| 6 | Click the waveguide in the list to observe the position (see Figure 81). |
Figure 81: Waveguide position
| 7 | Click the 3D Transverse tab, and select Modal, Local, or User in the Effective Refractive Index area.
Note: This refractive index will be used for calculating the magnetic components from electrical components and calculating the projection field if the tilting waveguide is used. |
| 8 | Specify the Gaussian beam polarization formation in the Polarization area (see Figure 82). |
Figure 82: Polarization area
| OptiFDTD provides five polarization options: – Linear X – Linear Y – Linear Theta – Left Hand Circular – Right Hand Circular |
|
| 9 | Set the Gaussian beam’s power and amplitude. |
Setting up the 2D Transverse Gaussian Beam Input
A 2D Gaussian beam setup is the same as 3D definition except that:
- 2D Gaussian beam is defined in one dimension
- TE /TM polarization
Setting up the 3D Transverse Rectangular Beam
The setup for a 3D rectangular beam is the same as that of the 3D Gaussian beam,
except the wave formation stays in a rectangular shape in the rectangular region.
Setting up the 2D Transverse Plane Wave Input (rectangular beam)
The setup for a 2D rectangular beam is same as that of the 2D Gaussian beam,
except the wave formation stays in a rectangular shape in the rectangular region.


