To view the simulation results, perform the following procedure.
| Step | Action |
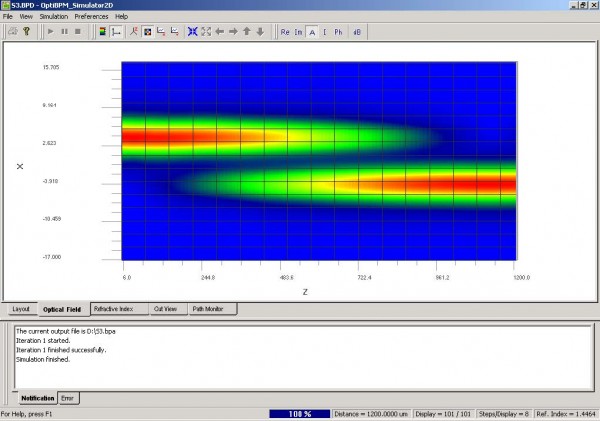
| 1 | In OptiBPM_Simulator, to view the optical field results, click the Optical Field tab, and click the Image Map button |
Figure 10: Optical Field — First result
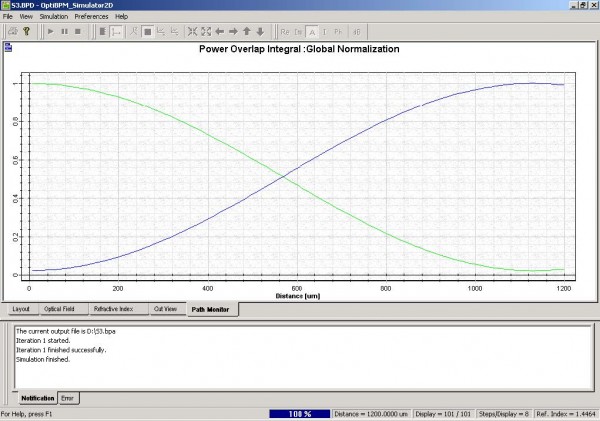
| 2 | To select the Path Monitor view, click the Path Monitor tab (see Figure 11). |
Figure 11: Path Monitor — First path
| Figure 10 and Figure 11 show that the energy is fully coupled into the second waveguide. Now we will study the coupling phenomenon with respect to the wavelength. | |
| 3 | Close the simulation window. |
| 4 | To return to the layout, click OK. |


