To run the simulation, perform the following procedure.
| Step | Action |
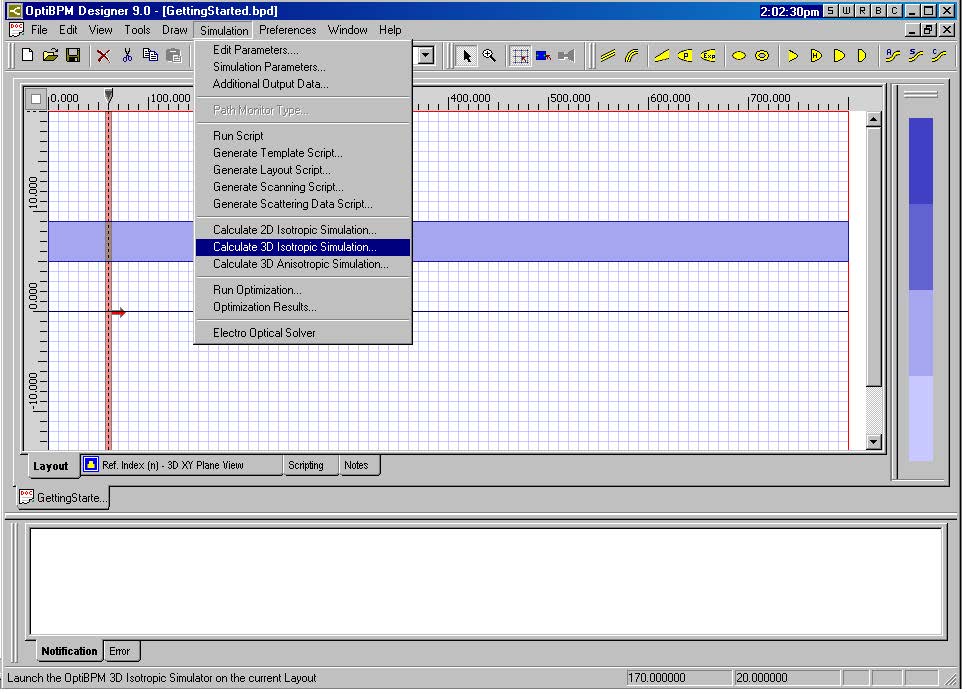
| 1 | From the Simulation menu, select Calculate 3D Isotropic Simulation (see Figure 27 ).
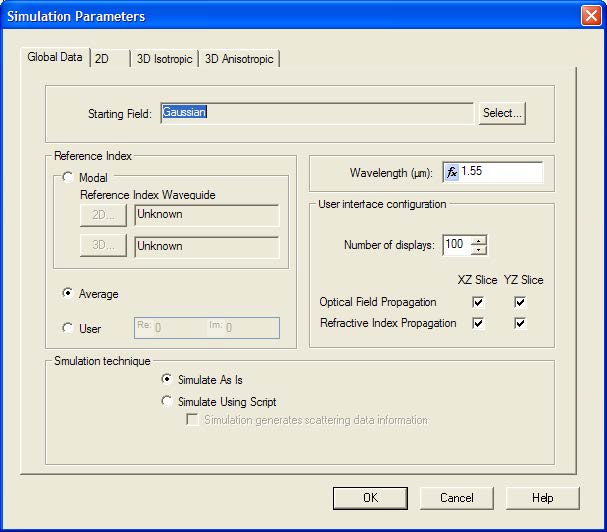
The Simulation Parameters dialog box appears (see Figure 28). |
Figure 27: Simulation Parameters selection
Figure 28: Simulation Parameters dialog box
| 2 | To start the simulation, click Run.
A message appears and prompts you to save the project and launch the simulator. |
| 3 | To save the project and start the simulation, click Yes.
The OptiBPM Simulator appears and the simulation starts. |
By default, the optical field is shown in the transverse plane. The progress of the simulation is displayed on the progress bar along the bottom of the window.
| 4 | Before the simulation is complete, click Pause.
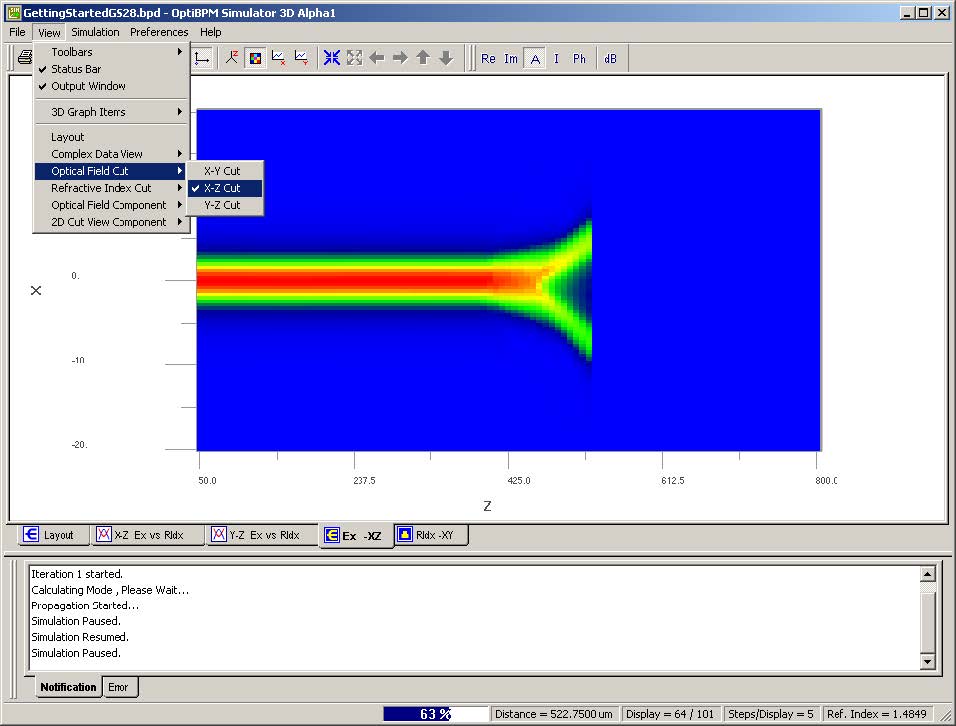
The data in the simulator can be viewed in different planes. For example, a Y Cut can be displayed by selection View > Optical Field Cut > XZ Cut to display the progress of the field in the mask plane (XZ plane) (see Figure 29). |
| 5 | Click Resume to continue the simulation. |
Figure 29: Y Cut view in Simulator
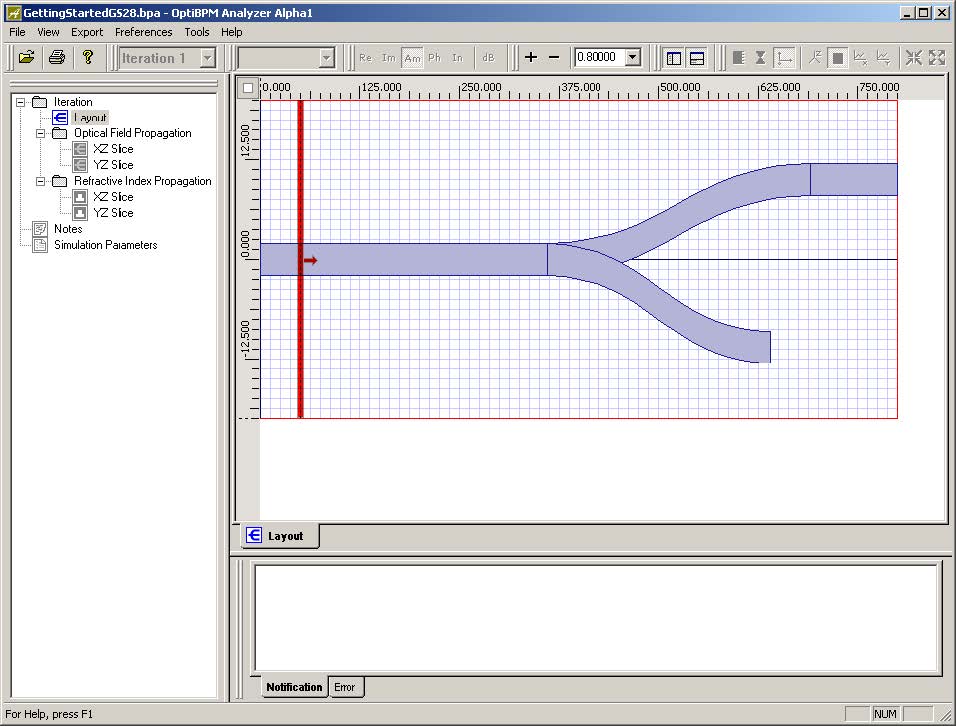
At the end of the simulation, a message appears and prompts you to open OptiBPM Analyzer (see Figure 30). The Analyzer is a separate application dedicated to postprocessing. When you perform a simulation, a file with the extension .bpa is created. The analyzer reads any .bpa file and displays results and facilitates postprocessing. You can review results of previous simulations using the analyzer. There is a tree in the Navigator window you use to select and organize results. Initially, a copy of the original layout is displayed (see Figure 31).
| 6 | To open OptiBPM Analyzer, click Yes.
The OptiBPM Analyzer dialog box appears (see Figure 31). |
Figure 30: OptiBPM Analyzer message
Figure 31: OptiBPM Analyzer
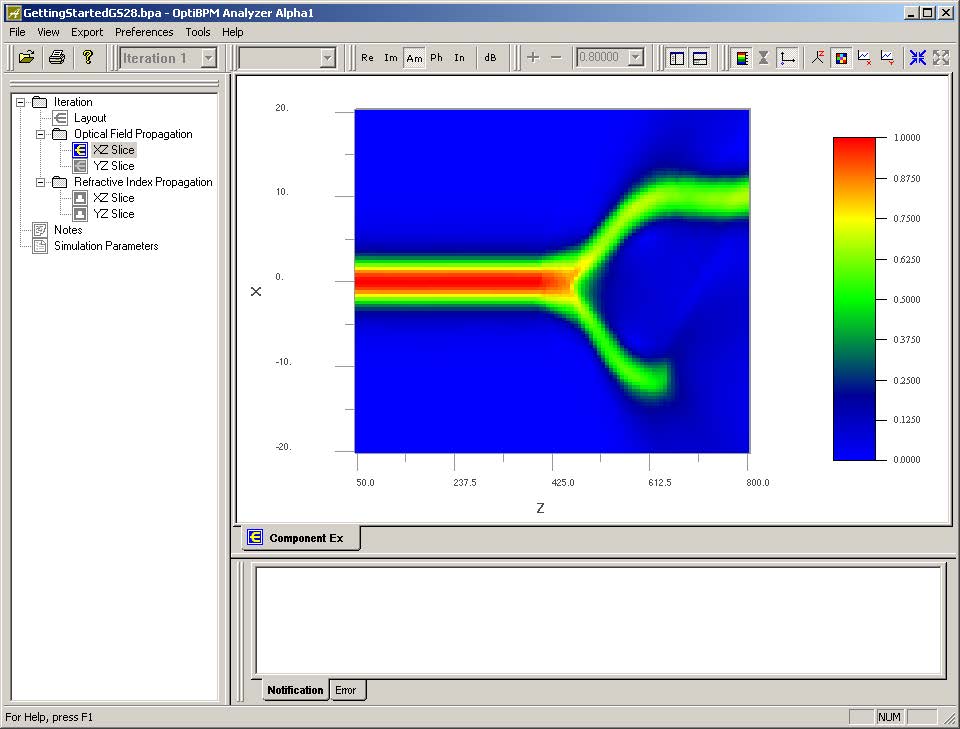
| 7 | Click on the tree item Iteration > Optical Field Propagation > XZ Slice to see the simulator display (see Figure 32). |
Figure 32: Simulator display
At this point, it is a good idea to investigate an important consideration in the use of the BP method.
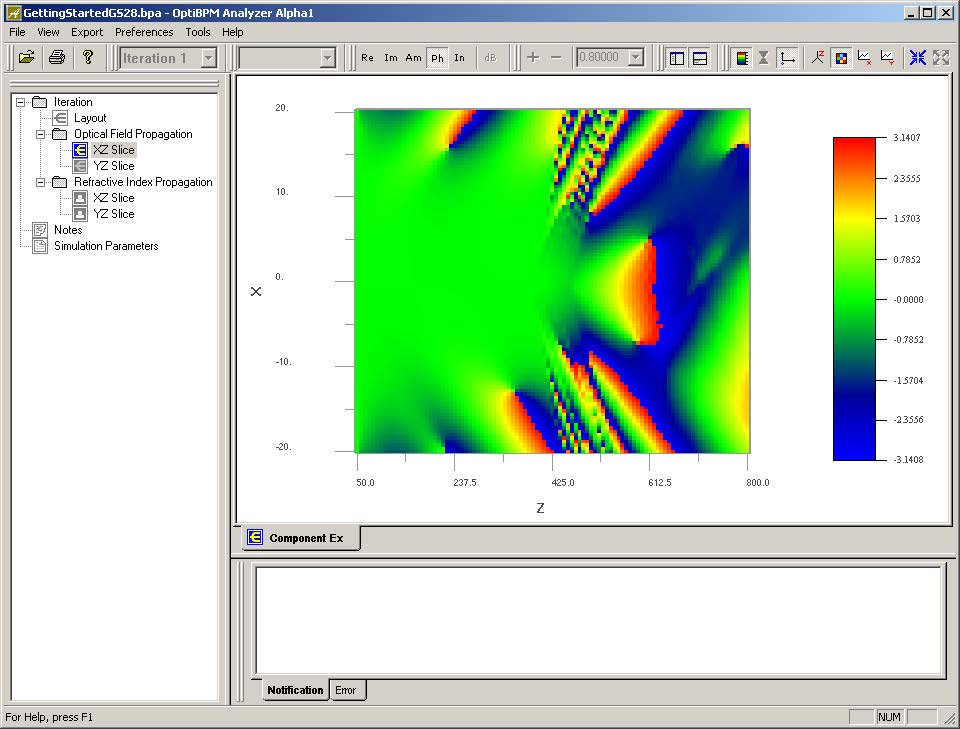
| 8 | Click the Ph button on the Data View toolbar (see Figure 33).
The phase distribution in the XZ plane is displayed in the window (see Figure 34). |
Figure 33: Data View toolbar
Figure 34: XZ plane phase distribution
Since the BPM uses a slowly varying envelope approximation, it is a good idea to check that the optical phase is not changing too quickly in the areas where most of the optical power is found (compare Figure 34 to Figure 32). Rapid variations in regions of high optical power indicate that the correct Reference Index has not been used.
In the Refractive Index Propagation branch of the tree, there is a record of the refractive index distribution that the simulator used for the calculation.
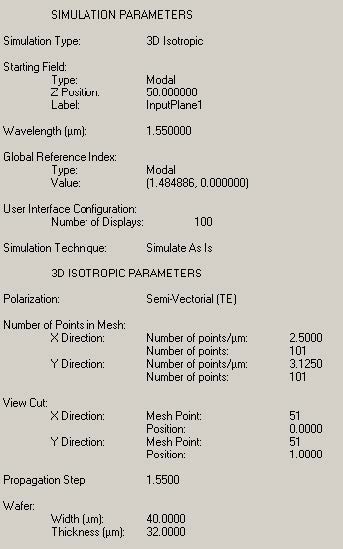
In the Simulation Parameters branch, there is important data about the simulation that is generated automatically. This includes the type of starting field, optical wavelength, Reference Index used by the simulator, propagation step, and other display and mesh data that are likely to be needed when the results are reviewed (see Figure 35).
Figure 35: Simulation results
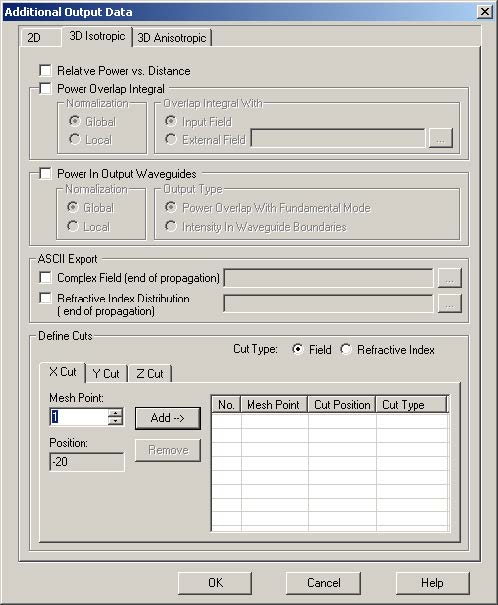
The data displayed in this lesson are only the data recorded by default. If more detailed results are needed, the OptiBPM Designer application (which this lesson started with) can specify many other output options. You can view these by selecting Simulation > Additional Output Data (see Figure 36) in the Waveguide Layout Designer.
Figure 36: Additional Output Data


