Scattering data generates an *.s file that you can export to OptiSystem. For more information on the *.s file and how to use it in OptiSystem, see the OptiBPM component NxM in the OptiSystem Component Library.
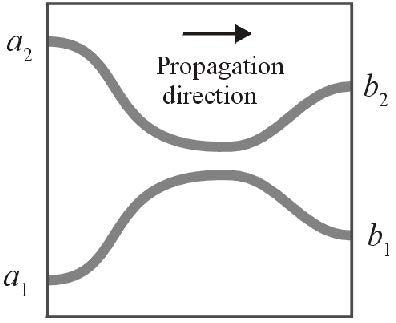
OptiBPM uses scattering data when a small part of a larger photonic circuit is isolated for characterization using BPM (see Figure 27). This smaller part has waveguides entering on the left side and exiting on the right side. The inputs and the outputs are assumed to have light in a modal configuration, although the input and output waveguides may be tilted.
Figure 27: Small part of large photonic circuit to be characterized by BPM
Since the propagation is assumed to be in one direction only, knowledge of the phase and amplitude of the two single mode input fields at the input is enough to predict the fields found at the output. Since the governing differential equations are linear, the relation between the a’s and b’s can be expressed by a matrix:

Or in a general form:

Where N is the number of input waveguides (input ports) and M is the number of output waveguides (output ports).
Note: These matrices actually do not correspond to those mentioned in Scattering Data. We preferred the classical notation known from the Scattering Matrix frequently exploited in microwaves. This section shows the explicit matrices as used in our approach.
Identification of the input ports
Waveguides crossing the input plane, numbered using integers starting from 1, in order from bottom to top (increasing X).
Identification of the output ports
Same as the Power in Output waveguides (waveguides crossing the Z+ extent of the wafer, numbered starting at 1 from bottom to top [increasing X]). The definition in Equation 2 demonstrates that OptiBPM can find the S values. One BPM calculation is performed for each wavelength and each input waveguide. The first wavelength is selected, fixing the row index k . Next, the first input waveguide a1 is set to 1.0, and the other waveguides are set to 0.0. The BPM calculation proceeds until the end, when the b values under these conditions can be determined. The b values in this case are the same as in the first column of the matrix in Equation 2. In the next step, another BPM calculation is performed, this time setting all inputs to 0 except for a2 , which is set to 1. The b values in this case are the same as in the second column of the matrix in Equation 2. All the values in the matrix can be found by making one BPM calculation for each column in the matrix (or one BPM calculation for each input waveguide). This calculates a complete row in the output file. To calculate the second row for the next wavelength, the next wavelength is then selected, and the whole process repeated.
The algorithm can be summarized as:
For each wavelength (index k)
{
For each Input waveguide (index i)
{
–Select input waveguide i
–Clear all input signals
–Apply input amplitude 1 and phase 0 to input waveguide i
–Simulate by BPM to the end of the wafer
For each Output waveguide (index j)
{
-Compute Power in Output Waveguide j
-Find the phase of Output Waveguide j
-Use the above to calculate bj
-Set Sij(k)=bj
}
}
}
The output is the number of input waveguides, number of output waveguides, the
wavelengths, and the array Sij(k) according to the description in OptiSystem
documentation.


