Calculating θdelay
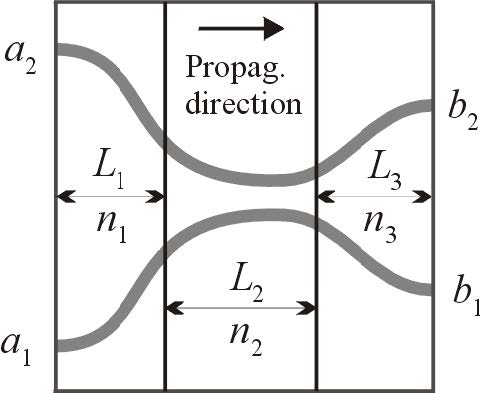
If the BPM calculation contains regions, the reference index n0 might not have the same value throughout the calculation (see Figure 28). In this case, you must make a weighted sum of the regions.
Figure 28: BPM layout with regions having different reference indices
For the layout in Figure 28, the phase delay is taken from the sum of the optical distances of the three regions
![]()
Calculating θwg
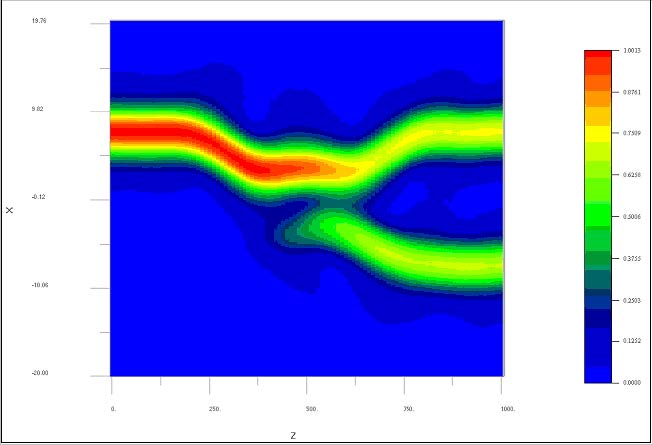
This angle is available from the complex field at the end of a BPM calculation. It is easiest to see this angle in a 2D calculation, because this information is always displayed in 2D. For a layout like the one in Figure 27, the BPM calculation result in
2D is shown in Figure 29.
Figure 29: Optical Field Amplitude in X-Z plane
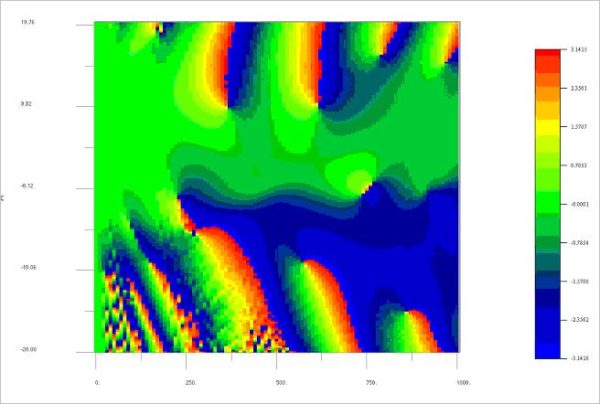
If you press the Ph key at the top of the display, the optical phase ( θwg ) appears (see Figure 30).
Figure 30: Optical Phase in X-Z plane
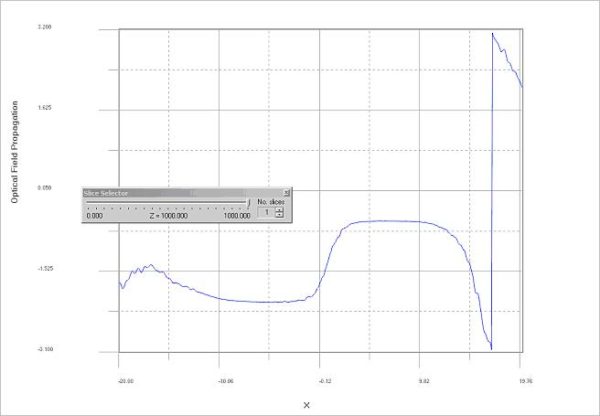
At the end of the calculation (z = 1000), the phase settles to a constant value in the regions of the waveguides (a different value for each waveguide). You can see this more clearly using the slice selector and setting the slice to the highest value (see Figure 31).
Figure 31: Optical Phase at the end of propagation
The phase being constant in the region of each waveguide is not a coincidence. It happens whenever the output waveguides are not tilted and the propagation has developed into a modal pattern (radiation modes have radiated away). You can calculate the S data for this example by using θwg = –2.12 for the first output waveguide and θwg = –0.54 for the second waveguide.


