
Proton exchange in Lithium Niobate involves a replacement of Lithium ions (Li+) by hydrogen ions, or protons (H+). The replacement causes a change in refractive index, thus forming a waveguide. Proton exchange is one of the methods used for forming optical waveguides in Lithium Niobate, LiNbO3, as well as in Lithium Tantalate, LiTaO3. The waveguide formation can have two stages:
• Basic proton exchange from an organic proton source.
• Annealing post processing.
Basic proton exchange takes place when the Lithium Niobate substrate is immersed in an appropriate proton source, usually an acid melt, and heated for a couple of hours at temperatures ranging from 150 to 300 degrees Celsius. Under these conditions, the two ion species counter diffuse, so that material is exchanged between the substrate and the melt. The annealing post processing involves solely heating of the sample to redistribute the Lithium and Hydrogen ions.
Before presenting more details, we note the following important remarks. In the OptiBPM model, only the extraordinary refractive index is affected (increased) by the proton exchange process. Changes of the ordinary index are negative. They are much smaller and therefore neglected.
Proton exchange process on its own leads to a step-function index profile with a change of the refractive index [4]

where the constants β = 0.1317 , γ = 3.4576 , δ = 1.75 are fitting parameters from experimental data, and x is the normalized H+ fractional concentration.
The waveguide depth after the exchange is obtained as [6]
![]()
where t is the exchange process time, D0 is the diffusion constant of the proton exchange process, Q is the activation energy, T is the process temperature, and where R is the universal gas constant. The most common sources of Hydrogen ions H+ are the benzoic acid and the toluic acid [7]. The exchange parameters of these two acids (Table 2), that is their exchange constants and activation energies, are hard coded in the OptiBPM program. However, any user source of H+ ions can be defined by providing its exchange constant D0V and activation energy Q .
Waveguides fabricated with pure melts are associated with serious problems, in particular, the degradation in electrooptic coefficient, a large scattering and insertion loss, and refractive index instabilities. It is therefore a common practice to anneal the samples after the exchange process in order to eliminate the compositional instabilities and to restore the material properties [5]. Annealing helps to avoid problems related to a high fraction of Hydrogen ions in the exchange waveguides.
Naturally, the post exchange annealing process leads to a different refractive distribution of the refractive index, which can be modeled as
![]()
where ne 0 is the extraordinary bulk index of the LiNbO3 substrate, Δnes is the maximum refractive index change on the surface, and f( y) and g( x ) are the distribution functions.
The distribution function in the horizontal direction after annealing is approximated in a similar fashion as in the case of Titanium diffused waveguide using the following error distribution function:
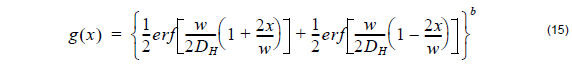
where the horizontal diffusion length DH is defined by user and b is the power of the horizontal distribution function.
The distribution function in the vertical direction is defined by the hyper-Gaussian dependence [4], [5]
![]()
where a is the power of the hyper-Gaussian distribution, usually ranging between 10 and 23, and DV is the diffusion depth after annealing or effective guide depth. The diffusion depth DV as well as the maximum refractive index difference after annealing Δnes might have much different values then the ones before annealing. It is up to the user to define these parameters which can be case dependent. As an example, we quote empirical relationships to calculate Δnes and DV for annealing at 200 and 400°C taken from [4], [5]:

where DV( 0 ) is the initial PE depth, Δnes(0) is the initial change of the refractive index after proton exchange and b, c, p, q are the fitting parameters (Table 3). The refractive index distribution is strongly dependent on the post-exchange time ta and the post-exchange temperature Ta .
In a case when the predefined profiles are found not sufficient, user has the option to define his own refractive index profiles by using the User Function Profiles in Profile designer.
| Taken from [6] | Toluic Acid | Benzoic Acid |
| Temperature range [oC] | 109-263 | 122-249 |
| Diffusion constant D0 [ μ m2/hr] | 7.02 ⋅ 107 | 7.36 ⋅109 |
| Activation energy Q [kJ/mol] | 75.58 | 94 |
Table 2
| Ta [oC] | b [hr–c] | c [–] | p [hr–q] | q [–] |
| 300 | 0.7031 | 0.0754 | 0.2325 | 0.1033 |
| 400 | 1.2884 | 0.7577 | 0.3749 | 0.6574 |
Table 3