
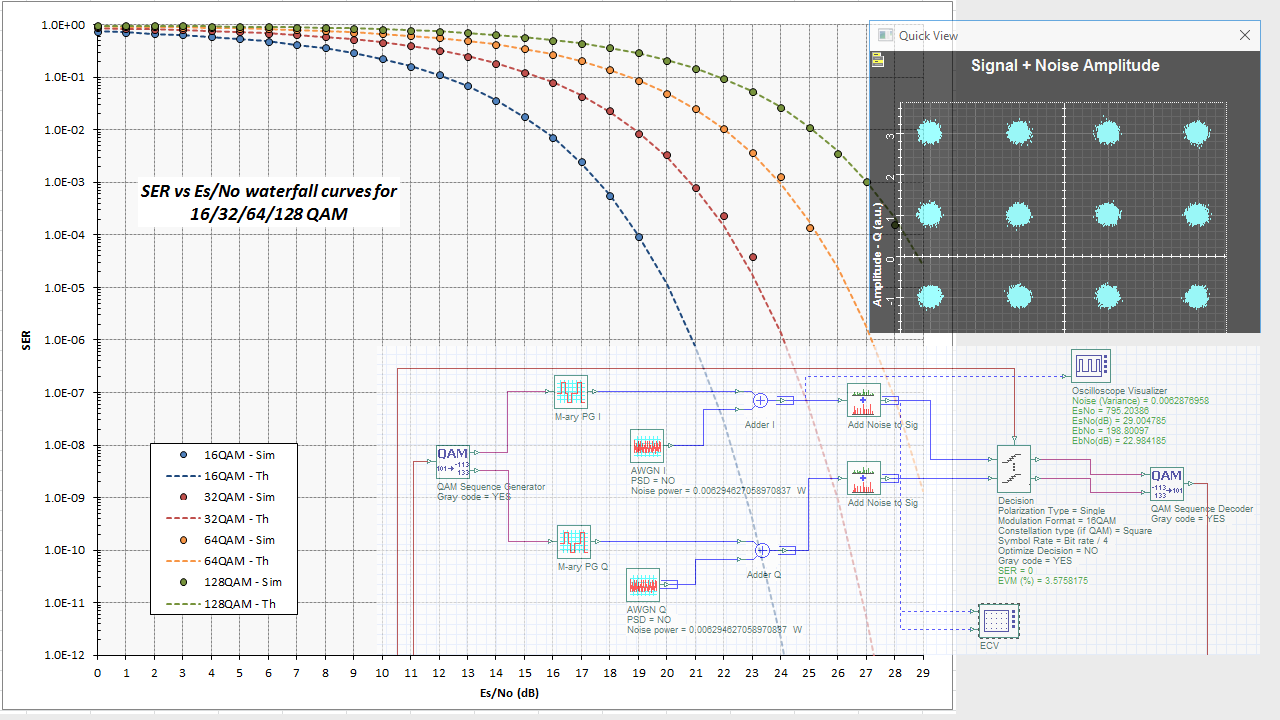
This application note demonstrates how to perform symbol error rate (SER) or bit error rate (BER) testing for higher order modulation systems. The typical output of an SER/BER analysis is a set of waterfall curves that map a system’s SER or BER results against increasing background noise levels, defined as Eb/No (the ratio of energy per bit to noise density) or Es/No (the ratio of energy per symbol to noise density). Three OptiSystem projects have been built to allow for the automatic creation of SER/BER waterfall curves for either pulse amplitude modulation (PAM), phase shift keying (PSK) or quadrature amplitude modulation (QAM) systems of varying order M (symbols per bit). The simulation curves are also mapped against the theoretical results to show how well the simulation results match to theory.
Compatibility: