Amplification of ultra-short optical pulses in SOA produces considerable spectral broadening and distortion due to the non-linear phenomenon of self-phase modulation. The physical mechanism behind SPM is gain saturation, which leads to intensity-dependent changes of refractive index in response to variations in carrier density. Signal-gain saturation in SOA is caused by a reduction of the population inversion in the active layer due to an increase in stimulated emission. Gain saturation characteristics are especially important in optical repeaters and multi-channel amplifiers which require high-power operation.
This lesson discusses the effect of gain saturation induced self-phase modulation on the amplification of Gaussian pulse. We will consider the pulses with pulse width much shorter than the carrier lifetime. The carrier wavelength of the Gaussian pulse is 1.55 mm.
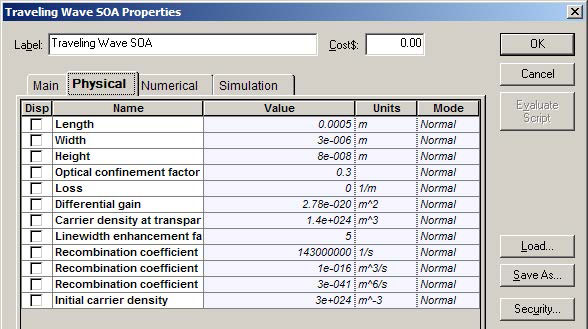
See Figure 1 for the SOA parameters.
Figure 1: SOA parameters
For these SOA physical parameter default values, the following parameter values are obtained:
- Carrier lifetime tC ~ 1.4 ns
- Saturation energy Esat ~ 3.7 pJ
- Amplification factor G0 = 29 dB
As a typical value of the line width, the enhancement factor α = 5 is used. Note that for now, the internal losses are zero. This enables a comparison with existing analytical solutions (see the reference at the end of the lesson). The results of this comparison are similar to the results from the SOA component. Later in this lesson, the influence of the internal losses will be analyzed.
Gaussian pulse with the following parameters was considered
Energy E0 ~ 0.73 pJ
TFWHM = 14 ps → P ~ 50 mW
Note the high value of the initial pulse power. It is the best way to demonstrate the basic qualitative features of gain-saturation induced properties of the pulse amplification. The influence of the value of the initial pulse power will be discussed later in this lesson.
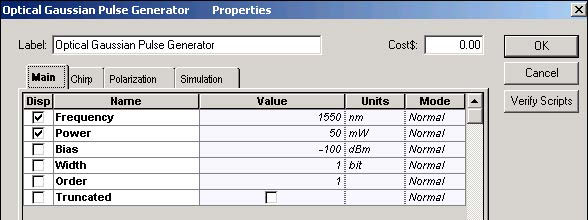
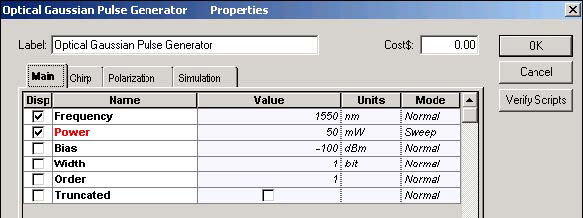
To obtain the required carrier wavelength and power, the following Optical Gaussian Pulse Generator parameters are set (see Figure 2).
Figure 2: Optical Gaussian Pulse Generator Main parameters
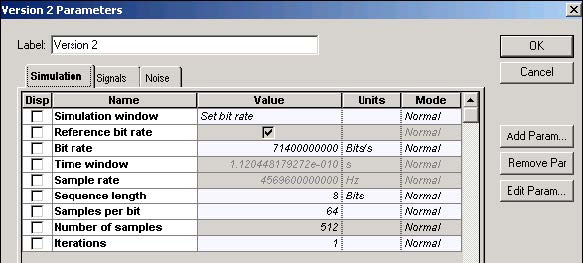
To obtain the Gaussian pulse with the desired TFWHM = 14 ps, the following global parameters have been set (see Figure 3).
Figure 3: Global parameters
As a result of the set parameters → T0 / tC ~ 0.006 and E0/Esat ~ 0.2
According to the first ratio, the input pulse width is much smaller than the carrier lifetime. The second ratio shows that the pulse energy is comparable with the SOA saturation energy.
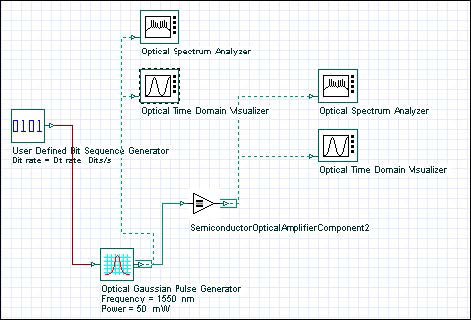
See Figure 4 to view the project in which the amplification of the Gaussian pulse with SOA will be analyzed.
Figure 4: SOA Gain Saturation project layout
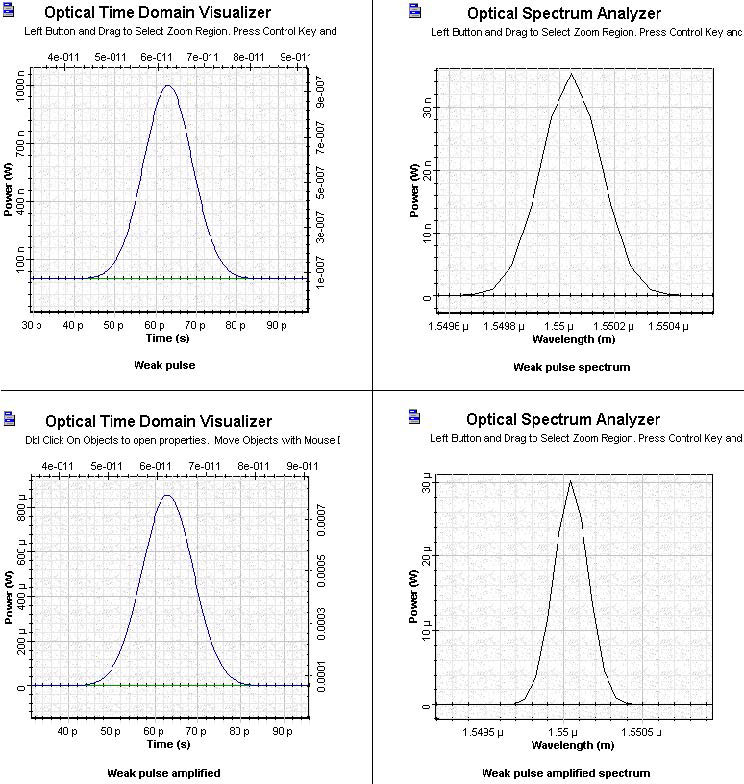
To illustrate the appearance of the gain saturation induced effects, Figure 5 shows the shape and the spectra of the weak and amplified Gaussian pulse at Pin 0.001 mW.
Figure 5: SOA weak and amplified pulse Comparison
Comparison of the two time figures shows that the pulse is amplified in the unsaturated region. No qualitative changes in the spectra of the amplified pulse are evident.
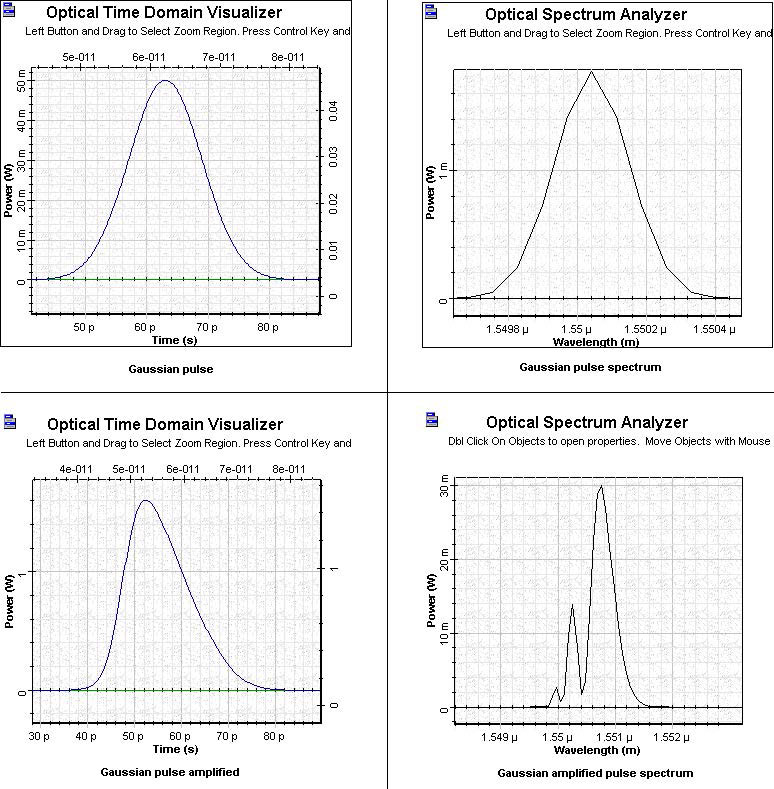
Figure 6 shows the shape and spectra of the initial Gaussian pulse which will be amplified in the saturation region.
Figure 6: SOA Gaussian pulse and amplified Gaussian pulse in saturation region
Figure 6 reveals that the amplified pulse becomes asymmetric — the leading edge is sharper than the trailing edge.
Note: The sharpening of the leading edge is a common feature of all amplifiers.
The pulse spectrum of the amplified pulse reveals features that are specific to the SOA.
The spectrum develops a multi-peak structure. The dominant peaks shift toward longer (red) wavelengths. This red shift increases with the increased amplification factor. The red shift observed in this figure is ~ 0.001 mm ~ 120 GHz.
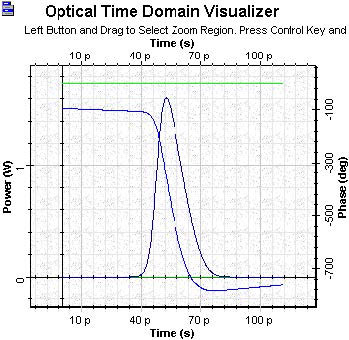
Figure 7 shows a phase of the pulse together with its shape. It is important to note that the phase follows the time evolution of the gain. For such a short pulse, the gain has no time to recover (T0/tC ~ 0.006).
Figure 7: SOA Gaussian pulse with saturation 50 mW final time phase
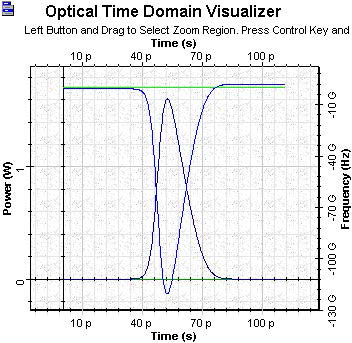
Figure 8 shows the gain saturation-induced chirp across the pulse together with its shape. Note that the initial Gaussian pulse is unchirped.
Figure 8: SOA Gaussian pulse with saturation 50 mW final time chirp
The gain saturation induced chirp is negative across the entire pulse. Therefore, the instantaneous frequency is downshifted (the red shift) from the incident frequency. Because the induced chirp increases towards the trailing part of the pulse, the chirp is positive. From the theory of propagation of phase modulated pulses in the medium with group velocity dispersion [3], it follows that the appearance of a positive chirp can be used for pulse compression in the medium with anomalous group velocity dispersion. This application of the gain saturation induced chirp will be considered in SOA gain saturation—Chirped and super Gaussian pulses.
The influence of the initial power, optical confinement factor, and inner losses on the observed properties will now be analyzed. Note that in the model used in [1] and [2], the inner losses have been neglected.
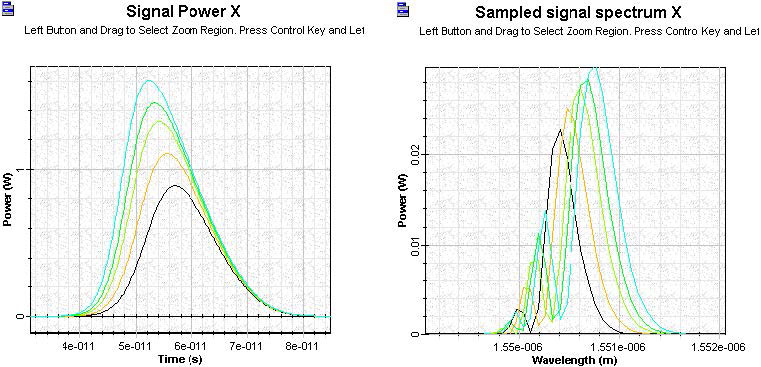
First we will see how the shape and spectrum of the amplified Gaussian pulse (for the same pulse and SOA parameters as above) change as a function from the initial pulse power. The values of the initial power considered were P = 5, 10, 20, 30, and 50 mW. In the first case, E0/Esat ~ 0.02.
To obtain these results, use the sweep mode (see Figure 9).
Figure 9: SOA Gaussian Pulse Generator parameters
Figure 10 shows the shape and spectrum of the amplified Gaussian pulse as a function from the initial power.
Figure 10: SOA Gaussian pulse signal
As expected, an increase in the ratio E0/Esat (for fixed pulse width) leads to an increase in the number of peaks in the spectrum and an increase of the red shift.
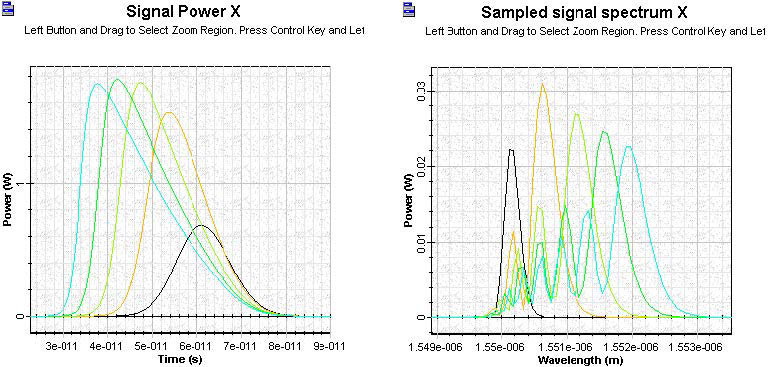
Figure 11 shows the shape and spectrum of the amplified Gaussian pulse (for the same pulse and SOA parameters as above) as a function from the optical confinement factor. The value of the optical confinement factor considered are Γ = 0.1, 0.2, 0.3, 0.4, 0.5
Figure 11: SOA amplified Gaussian pulse signal
The optical confinement factor influences the pulse shape and spectrum.
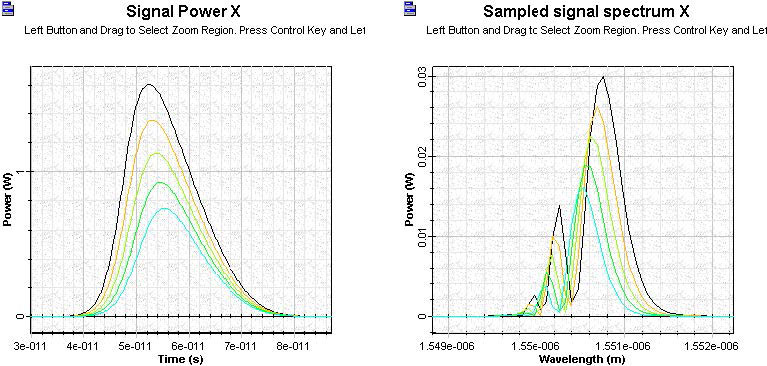
Figure 12 shows the shape and spectrum of the amplified Gaussian pulse (for the same pulse and SOA parameters as above) as a function from the internal losses. The value of internal losses considered are: 0, 1000, 2000, 3000, and 4000 (1/m).
Figure 12: SOA amplified internal loss Gaussian pulse signal
In contrast to the optical confinement factor, the internal losses do not influence the pulse shape and spectrum.
In this lesson, we have observed the basic properties of the isolated Gaussian pulse amplification with SOA component of OptiSystem software for gain saturation.
• Both the shape and the spectrum of the amplified pulses are asymmetric
• The spectrum develops multi-peak structure with well-expressed red shift
The obtained results are in complete agreement with previously published results [1] and [2].
References:
[1] G.P. Agrawal and N.A. Olsson, “Self-phase modulation and spectral broadening of optical pulses in semiconductor laser amplifiers”, IEEE Journal of Quantum Electronics, Vol. 25, pp. 2297-2306, 1989.
[2] G.P. Agrawal, “Fiber-Optic Communication Systems”, 2nd Edition, John Wiley & Sons Inc., 1997.
[3] G.P. Agrawal, “Nonlinear Fiber Optics,” 3rd Edition, Academic Press, 2001.


