This lesson applies the results from SOA gain saturation—Gaussian pulses for interpretation of the experimental results on the amplification of Gaussian pulse with SOA obtained in [1]. The aim of [1] was to report the first investigation of the spectral characteristics of pulse amplification in SOA.
Parameters of SOA given in the paper are:
Saturation energy Esat ~ 6 pJ, and the values of the amplification factor: For a drive current of 30 mA → G0 ~ 11 dB and for a drive current of 130 mA → G0 ~ 30 dB.
There is no information about the carrier lifetime, which makes it impossible to determine the exact value of the ratio T0/tC. There is also no information about the inner losses of the amplifier. Note that model used in [1] does not take into account the inner losses of the amplifier.
The input Gaussian pulse parameters in the experiment are: TFWHM = 15.6 ps, and input pulse energy E0 ~ 0.18 pJ → E0 / Esat ~ 0.03, where the pulse width is much shorter than the carrier lifetime.
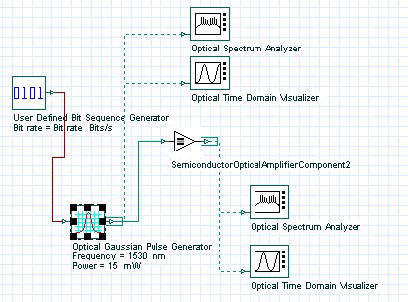
The experiment has been analyzed in the framework of the layout in Figure 2.
Figure 1: SOA Gain Saturation comparison project layout
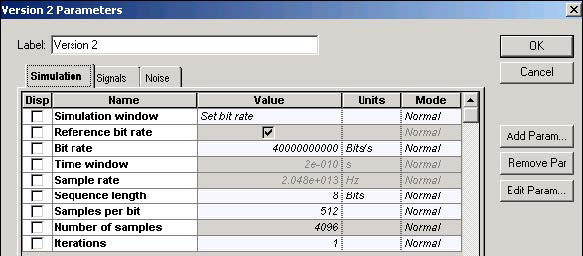
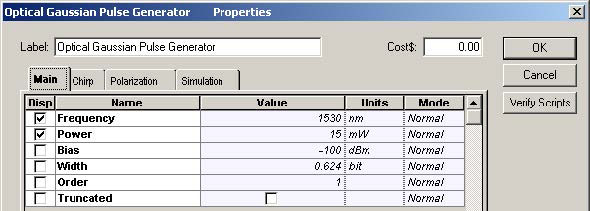
The following global parameters and Optical Gaussian Pulse Generator parameters have been used (see Figure 2 and Figure 3).
Figure 2: Global parameters
Figure 3: Optical Gaussian Pulse Generator Main parameters
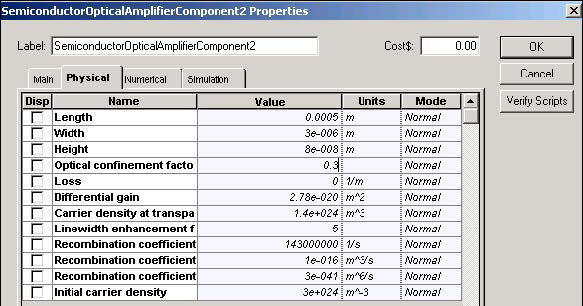
We will use the Bit Rate B = 40 Gb/s. Therefore, TB = 25 ps. To obtain TFWHM = 15.6 ps, a duty cycle of 0.624 was used. To obtain a single pass gain of ~30 dB in the experiment, we used the following SOA parameters (see Figure 4).
Figure 4: SOA parameters
Note that for these estimations, the influence of the inner losses is neglected. The corresponding saturation energy Esat is approximately 5 pJ. To satisfy the experimental condition Ein/Esat ~ 0.003, the pulse peak power 15 mW is used.
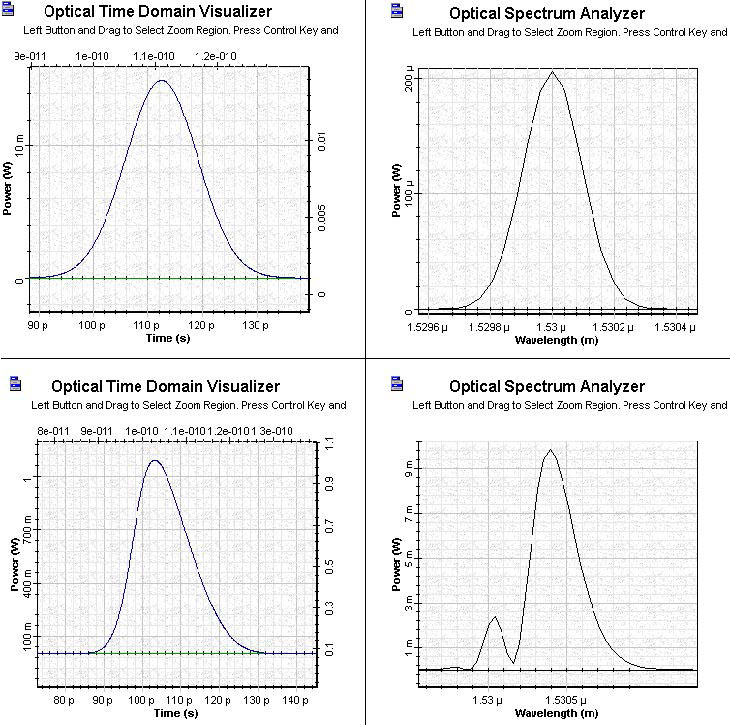
Figure 5 shows the shape in time and in frequency domain of the initial and amplified pulses.
Figure 5: Time and frequency domain of initial and amplified pulses
The spectrum of the amplified pulse clearly shows the following properties:
- peak output wavelength is red shifted with ~ 0.3 nm
- secondary peak appears approximately 0.4 nm below the main peak
- main peak is broadened considerably
- experimentally observed value for the red shift of the peak wavelength is 0.31 nm and the measured peak separation is 0.4 nm
As we can see, our numerical observations are in very good agreement with the experimental and model results of [1].
In this lesson, the experimental results of [1] were compared to the results of our SOA model. A good qualitative and quantitative agreement has been established.
References:
[1] N.A. Olsson and G.P. Agrawal, “Spectral shift and distortion due to self-phase modulation of picosecond pulses in 1.5 mm amplifiers”, Appl. Phys. Lett, Vol. 55, pp. 13-15, 1989.
[2] G.P. Agrawal and N.A. Olsson, “Self-phase modulation and spectral broadening of optical pulses in semiconductor laser amplifiers”, IEEE Journal of Quantum Electronics, Vol. 25, pp. 2297-2306, 1989.


