
This lesson demonstrates the broadening of a “very short” (Dirac δ-shaped) pulse caused by polarization mode dispersion (PMD). It also shows that the probability distribution function of the differential group delays between the principal states of polarization generated by the component agrees well with the Maxwellian one.
The “coarse step” method [4], [5] with fiber segments with variable length [6] is used.
This example is an illustration of the low coherence model (see e.g. [3], [7], [8]) i.e. the definition of PMD that neglects the coherence of the light. Let I(t, z) be the time-dependent intensity at position z along a fiber with high polarization mode coupling, when a short (with respect to the polarization mode delay) pulse is launched. The following expression for the RMS width of the pulse exists [1] – [3]:
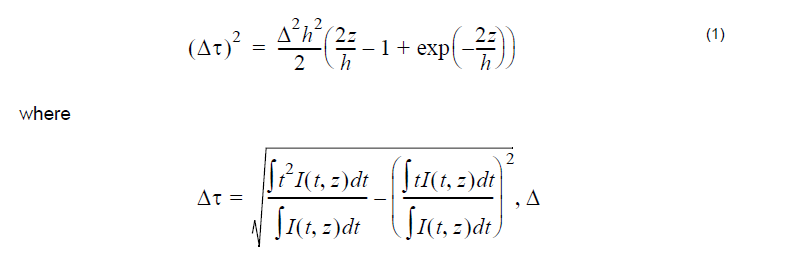
is one half of the difference of the group delays per unit length between the fast and slow axes of the fiber and h is the mean coupling length.
In the limit z >> h (high polarization mode coupling) I(t, z) is close to Gaussian, Δτ is its full width and Equation 1 becomes:

The PMD coefficient parameter in the optical fiber component (DPMD) is (DPMD) = 2Δ√h .
The layout is shown in Figure 1. Figure 2 gives the parameters of the pulse generator and the optical fiber components. Note that all the effects, except PMD, have been disabled in the setup of the optical fiber component.


Figure 1: Layout parameters and layout
In this case, the pulse width plays the role of the source coherence time. Since the pulse width (FWHM) is initially 50 fs (the coherence time of a typical LED is in the order of 60 fs), and the differential group delay (the half-width of the Gaussian distribution) after 200 km of propagation is several picoseconds, we are well within the limits of applicability of the low-coherence model.


Figure 2: Parameters of pulse generator and nonlinear dispersive fiber
Figure 3 illustrates Equation 2 for one and same PMD coefficient
(DPMD = 0.5ps / √km ) and fiber length (200km) but for different coupling lengths.
The obtained dependence of the pulse RMS width has been fitted with a square-root
function:

with the fitting given in each case (Figure 3). It can be seen that Equation 2 and the
obtained results agree well when the number of scattering events is sufficiently large.


Figure 3: Illustration of different coupling lengths
Figure 4 gives an idea about the importance of the variable scattering section length (non-zero scattering section dispersion) [6]. While in the case of N identical scattering segments only N delay times (or partial pulses) are produced, when non-zero value for the dispersion of the scattering length is used, the number of delay times (partial pulses) is increased (to 2N), according to [6].


Figure 4: Lscatt = 10km σscatt = 0 (top) σscatt = 2km (bottom). Fiber length is 200km
Note: Twenty “partial” pulses (or delay times [6]) are evident in the case of fixed scattering section lengths.

Figure 5: Intensity distribution after 200km of propagation
Lscatt = 500m, σscatt = 100, DPMD = (0.5ps)/(√km)
Figure 5 gives an example about the output intensity distribution used to calculate the curves shown in Figure 3.
 with histogram (right)")
 with histogram (right)")
Figure 6: DGD of a fiber (left) with histogram (right)
Note: For a comparison, the Maxwellian distribution corresponding to the expectation value of the DGD (‹Δτ› = D√L) is also shown. The values of the parameters are:

Next we concentrate on the statistical properties of the PMD simulation module of the optical fiber component. This set of results (Figure 6 and Figure 7) pertains to the high-coherence model (see e.g.[3], [9]), based on the concept of principal states of polarization (PSP). The probability distribution function of the differential group delays (DGD) between the PSP is Maxwellian (see e.g. [8]). Jones matrix eigenanalysis [10] is used to calculate the DGD between the PSP of the fiber as a function of the carrier wavelength of the signal. The results for this dependence, together with the histograms obtained from the data, are displayed in Figure 6 and Figure 7.
The theoretical (Maxwellian) distribution functions, corresponding to the expected
value of the DGD ‹Δτ› = D√L (in the case of strong polarization mode coupling,
i.e. fiber length much bigger than the coupling length) are also shown. The histograms
agree well with the Maxwellian distributions. Increasing the number of DGDs
(increasing the wavelength range) makes the agreement even better (Figure 6,
396 DGDs, and Figure 7, 1299 DGD’s).
 with histogram (right) with different parameters")
 with histogram (right) with different parameters")
Figure 7: DGD of a fiber (left) with histogram (right) with different parameters
Note: Parameters are:
Lscatt = 1000m, σscatt = 200m
The impact of the variable scattering section length on the PMD statistics can be demonstrated by the following example. The system considered (RZ, 40GB/s) is presented in Figure 8.


Figure 8: Variable scattering length impact on PMD statistics—Layout and parameters
The thermal noise parameter of the photodetector is set to 3 x 10-20 W/Hz. In the optical fiber component all the effects except PMD are disabled, and the reference wavelength is set to 1550nm.
Note: In order to study the PMD statistics (probability distribution functions), the reference wavelength must be fixed (“User defined reference wavelength parameter” in the Optical fiber component must be set to TRUE). Otherwise, the PMD-induced system penalties will not show any dependence on the carrier wavelength of the signal. On the equivalence between ensemble averaging and spectral averaging (see e.g. [7]).
The results for the Q-factor of the system, as a function of the carrier wavelength calculated with both fixed and variable scattering section length is shown in Figure 9.


Figure 9: Q-factor as function of carrier wavelength with fixed and variable scattering section length
In the case when fixed scattering section length is used, the Q-factor is a periodic function of the wavelength. No such periodicity appears in the case of variable scattering section length calculation. The observed periodicity in the first case is related to the spectral periodicity of DGD between the PSPs of the fiber (see e.g. [11]). The period of the latter is the inverse DGD induced by a single scattering section [11] and its value agrees well with the results presented in Figure 9. When working with fixed scattering section length, the spectral interval covered by the simulation must be smaller than the spectral period of the DGDs (the inverse of the DGD induced by a single scattering section) to ensure the statistical independence of the collected data.
References:
[1]N. Gisin, J. P. Von der Weid, and J. P. Pellaux, JLT vol. 9, No. 7, pp. 821 (1991).
[2]Y. Suetsugu, T. Kato and M. Nishimura IEEE Phot. Technol. Lett. Vol. 7, No. 8, pp. 887, (1995).
[3]N. Gisin and J. P. Pellaux, Opt. Commun. Vol. 89, pp. 316, (1992).
[4]C. D. Poole and D. L. Favin JLT, vol. 12, No. 6 pp. 917, (1994).
[5]D. Marcuse, C. R. Menyuk and P. K. A. Wai JLT, vol. 15, No. 9, pp. 1735 (1997).
[6]C. H. Prola Jr., J. A. Pereira da Silva, A. O. Dal Forno, R. Passy, J. P. Von der Weid, and N. Gisin IEEE Phot. Technol. Letters, vol 9, No. 6, 842 (1997).
[7]C. D. Poole and J. Nagel in: Optical Fiber telecommunications vol. IIIa, eds. I. Kaminow and T. Koch, chapter “Polarization effects in lightwave systems”, p. 114.
[8]N. Gisin, R. Passy, P. Blasco, M. O. Van Deventer, R. Distl, H. Gilgen, B. Perny, R. Keys, E. Krause, C. C. Larsen, K. Morl, J. Pelayo and J. Vobian, Pure Appl. Opt. 4 pp. 511, (1995).
[9]C.D Poole and R.E. Wagner, Electron Lett. 22, 1029, (1986).
[10]B. L. Heffner IEEE Phot. Technol. Lett., 4 No. 9, 1066, (1992).
[11]H. Kogelnik and R. M. Jopson in: Optical fiber telecommunications IVB, eds. I. Kaminow and T. Li, Academic Press, p.725 (2002).