OptiFiber 1.5 directly supports experimental reference. index profiles scanned with
the NR-9200 optical fiber analyzer from EXFO Inc. The fiber parameters calculated in
that way provide indispensable feedback information to the product designer and
reduce the optimization cycle and the time-to-market.
The experimental profile “FromNR9200.asc” and the OptiFiber project
“FromNR9200.fcd” used in this lesson can be found in the Samples directory.
Experimental procedures
| Step | Action |
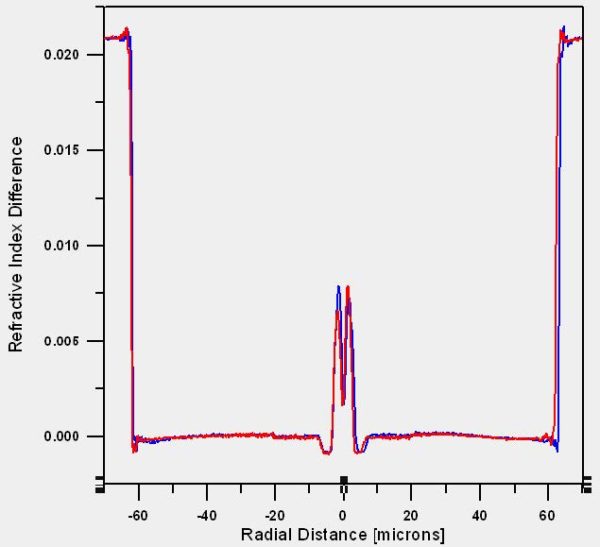
| 1 | First measure the refractive index profile of the fiber sample under test as described in the user manuals of NR-9200. The raw scanned profile data usually look as in the picture below. The X- and Y-axis scans are shown in different colors. |
| 2 | Save the refractive index data using the native NR-9200 format in a file named, for example, “FromNR9200.asc” . . “.asc” is the default file extension, however the profile files may have any extension, provided their internal structure is in the NR-9200 format. |
| 3 | Transfer this file to the computer, where OptiFiber is installed. |
Importing the experimental profile
OptiFiber is loaded with drivers that directly interpret the experimental data measured
and recorded by NR-9200. In order to use the profile data of the sample under test do
the following:
| Step | Action |
| 1 | Start a new blank project by selecting “File/New” |
| 2 | Import “FromNR9200.asc” by selecting “File/Import Profile…” . Within the “File Open” dialog select “Files of Type” – “EXFO NR-9200 Data File (*.asc)”, which is the default file type. |
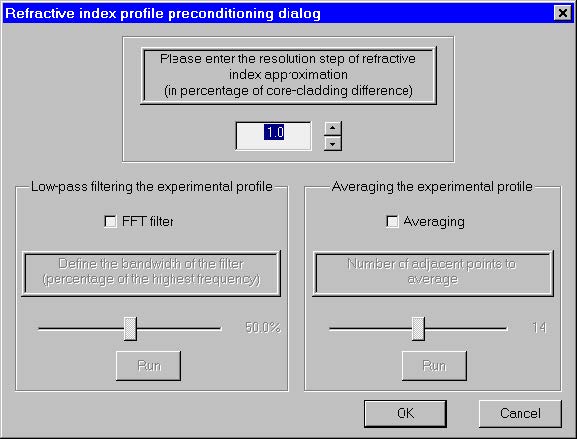
| 3 | After the file has been read the “Refractive index profile preconditioning dialog” appears: |
It offers the choice of reducing the number of fiber layers (which is typically > 1000)
in a search for a reasonable compromise between accuracy and computer load. It
allows also to filter and smooth the profile.
| 4 | Select the default resolution step of 0.0, which means that every experimental point will be interpreted as a distinct layer, and press “OK”. |
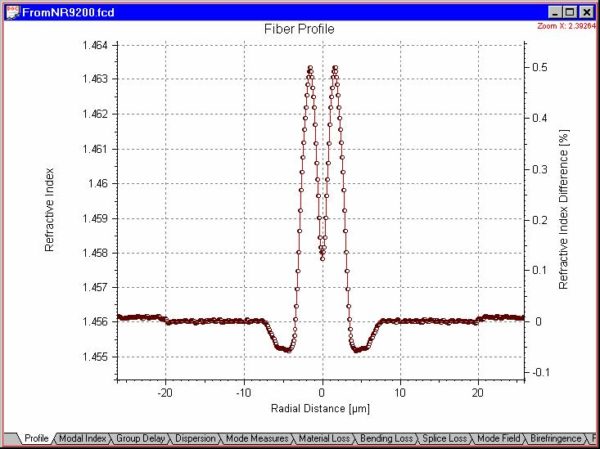
| 5 | At that point OptiFiber processes the experimental profile: makes it symmetrical, finds the axis position, etc. (see Technical Background/ Compatibility with the NR-9200 Optical Fiber Analyzer …). The adapted profile looks in the “Profile” view tab of OptiFiber as shown below… |
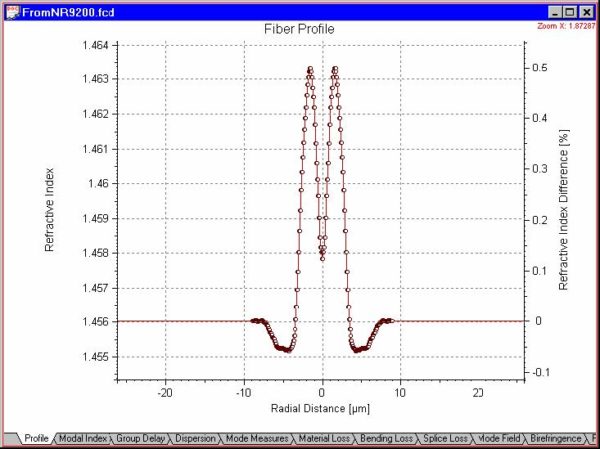
If the user is interested in the general trend of fiber parameter change vs. some
technological parameter (layer thickness, reference. difference) instead of its exact
absolute value, he may prefer to delete manually some of the cladding layers. The
next profile is obtained from the one shown above after such operation.
In that way the number of layers is reduced by ~75%, which greatly alleviates the
resource needs of the optimization calculations. When the trends in the behavior of
the design vs. its parameters are known, the user can return to the initial full profile.
Calculating the parameters of the fiber sample
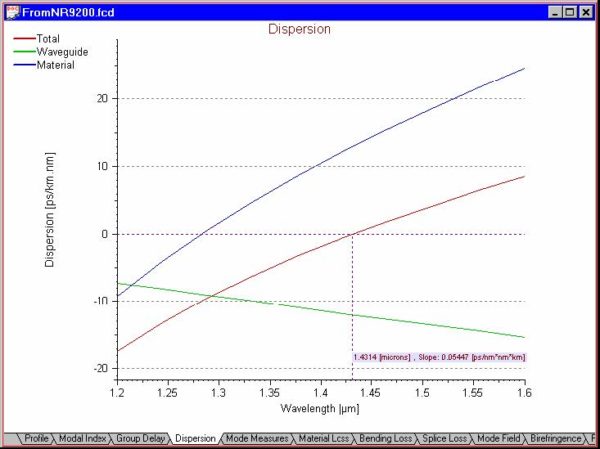
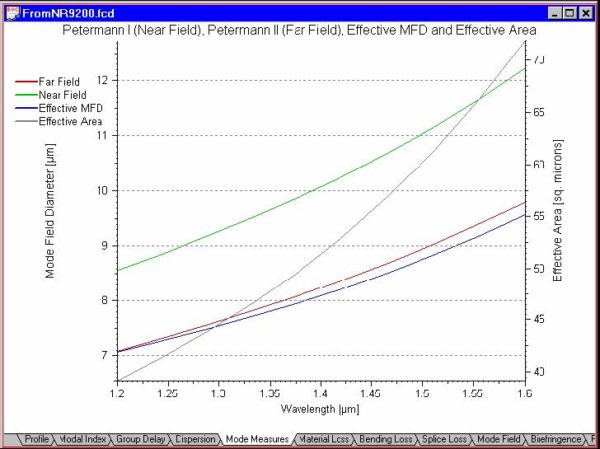
- Proceed with the usual routines. For example, the calculated dispersions and MFD of that particular experimental profile are shown in the following pictures:


