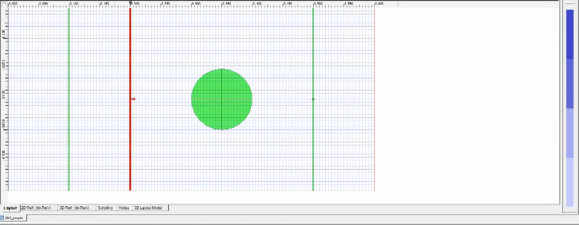
Using OptiFDTD the transmission spectrum of a gold nanoparticle can be calculated.
The simulation can begin using a 64-bit calculation engine where the user can only see a progress bar which allows us to cut down on CPU and memory overhead which is critical for running larger designs.
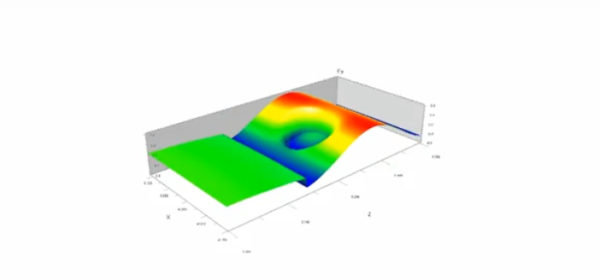
In 32-bit mode the real-time field data can be observed. The electric field can be viewed in 3 dimensions or in 2 dimensional topographic view.
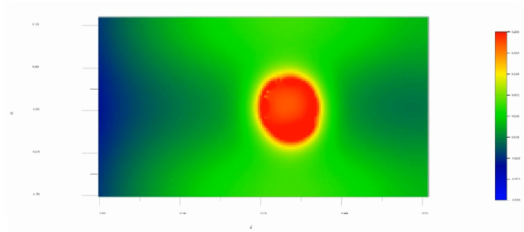
In 2D you can see the field patterns generated by the interaction between the input plane wave and the nanoparticle intensity values can be referenced by the color palette on the right hand side. Below you can see that the field is significantly enhanced around the nanoparticle surface.
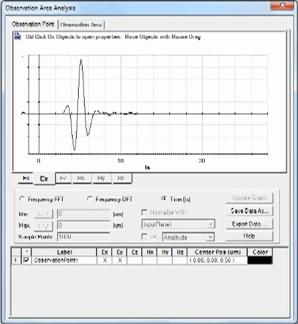
Observation points can also be analyzed. Below you can find the time domain and frequency domain responses.
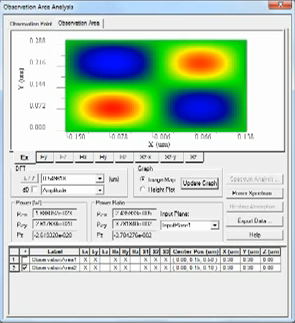
The observation area can also be analyzed. Power transmission ratios and normalised powers for each wavelength can be computed. Each field component can be analyzed individually.


