
Base
| Full Name | Thomas Freir |
| Organization | Dublin Institute of Technology |
| Job Title | Lecturer |
| Country |
Forum Replies Created
I figured out the second question, it was the fibre dispersion.
Can anyone from the optisystem team answer the first part.
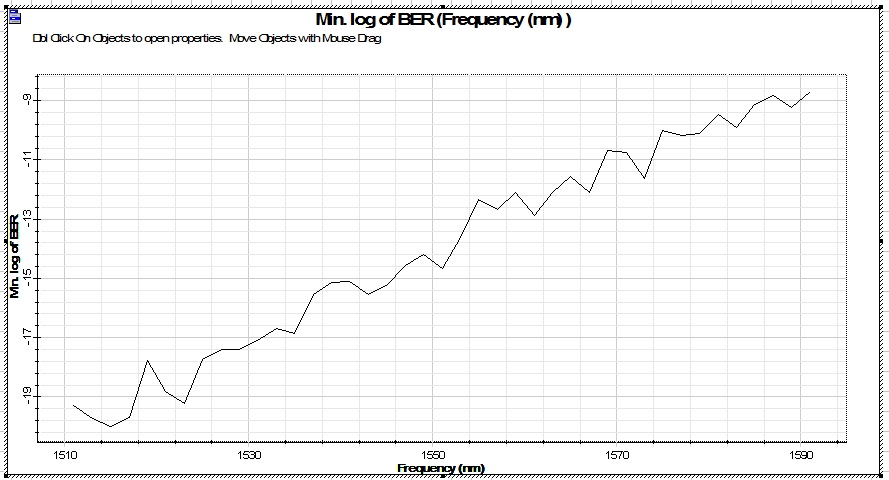
Graph of wavelength versus BER
Attachments:
Can someone from the optisystem team have a look at this please?
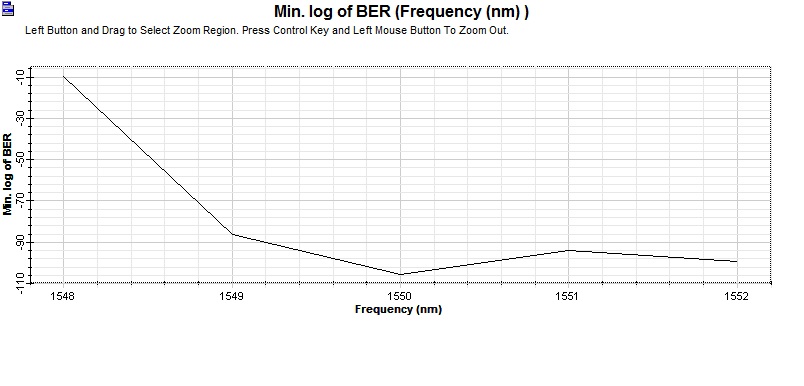
How did you view the output as log of BER and frequency? Used the report function
But I checked the component results of BER analyzer and I saw the min Log BER as -86.041. I am not sure whether it is right or not. Just giving an idea. (After you run the simulation did you check the BER for each sweep, not just the last one)?
Graph attached
Attachments:
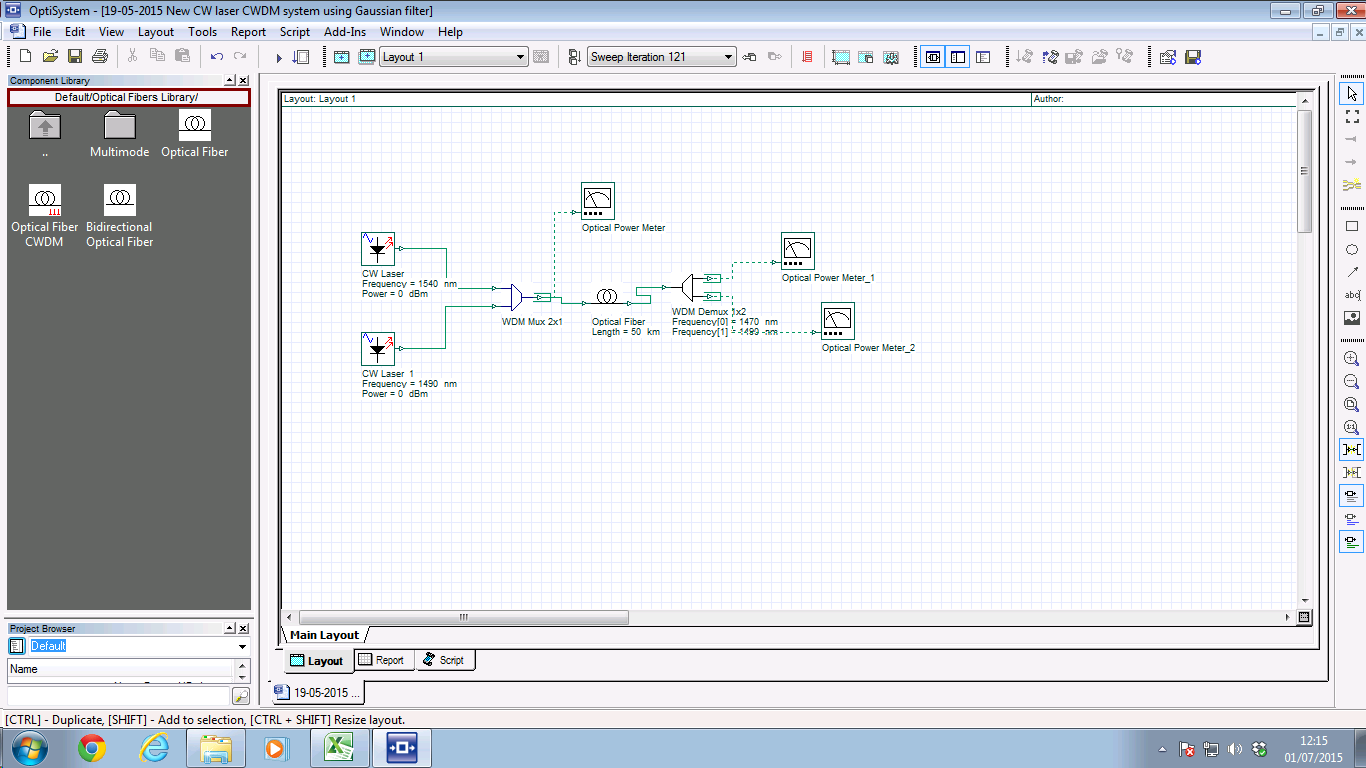
Simulation is attached
Thanks for that, I presume you mean the power combiner on page 1293
Sorry
Attachments:
Simulation
Result graph
Attachments:
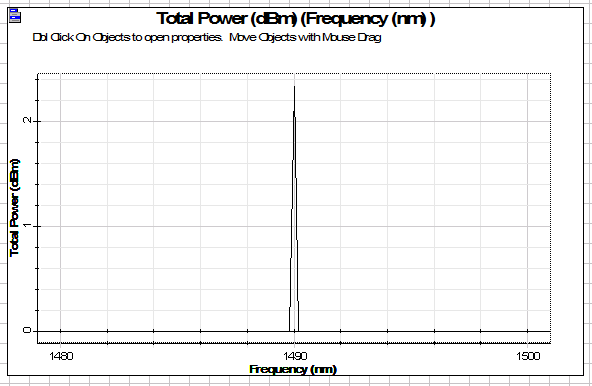
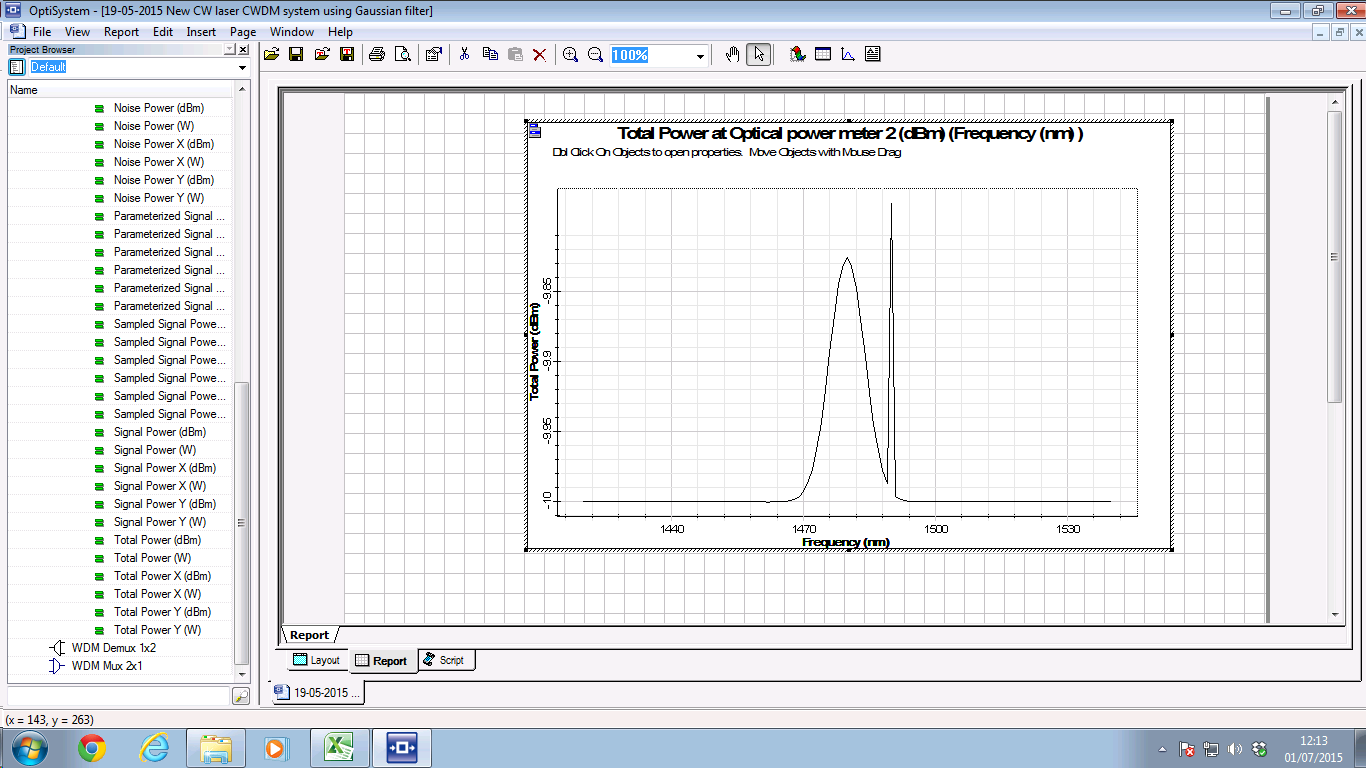
Under ideal circumstances Laser 1470 would arrive at power meter 1 with a power of -10dBm. Laser 1490 would arrive at power meter 2 with a power of -10dBm.
The picture “Result” shows the power measured at power meter 2. You will see that the lowest power on this graph is -10dBm. This is the expected power from the 1490 laser. In addition to this there is a gaussian shaped bulge. This is an unwanted leakage of power from the 1470nm laser as its wavelength is swept over a range. I would expect this result and have confirmed it elsewhere.
The unexpected result is the spike of optical power to the right of the gaussian shaped bulge.
The reason I am building this model is that CWDM lasers are expected to drift in wavelength domain. I know the drift in this case is excessive but I am trying to validate the model.
Thanks for your time.
The WDM mux and demux are band pass filters with a Gaussian response. As the CW laser has its wavelength changed some of the CW laser will leak through. The MUX and demux are not ideal.
Don’t mind the range I have swept over. This is just so I can see how the filters perform. In practice the lasers will only be drifting by a few nanometers.
Remember in CWDM systems the lasers are allowed drift from their central wavelength by plus of minus 6.5nm. I want to explore how this wavelength drift effects adjacent channels.
I had to attach the pictures separately.
Attachments:
Thank you for the reply Damian,
I am trying to model a CWDM system using typical values for transmitters/lasers from manufactures data sheet. Linewidth is typically specified in nanometers usually 20dB from the peak. I have yet to identify a data sheet for CWDM lasers that specifies the phase noise. How would you suggest I proceed?