
Home › Forums › GENERAL › Digital to analog converter › Reply To: Digital to analog converter
June 6, 2018 at 12:05 pm
#48999
Mohamed A. A. Abouseif, Thanks for your interest.
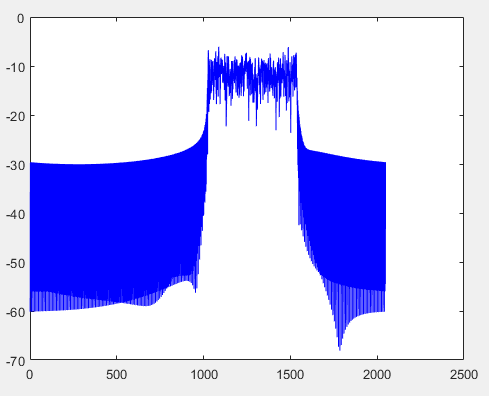
My main goal is to display the GFDM waveform spectrum in the RF spectrum analyzer component, i use only MATLAB and i get the correct spectrum depicted in figure1.
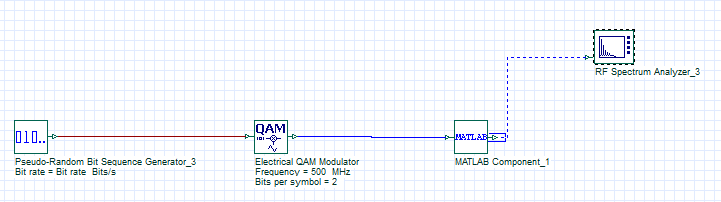
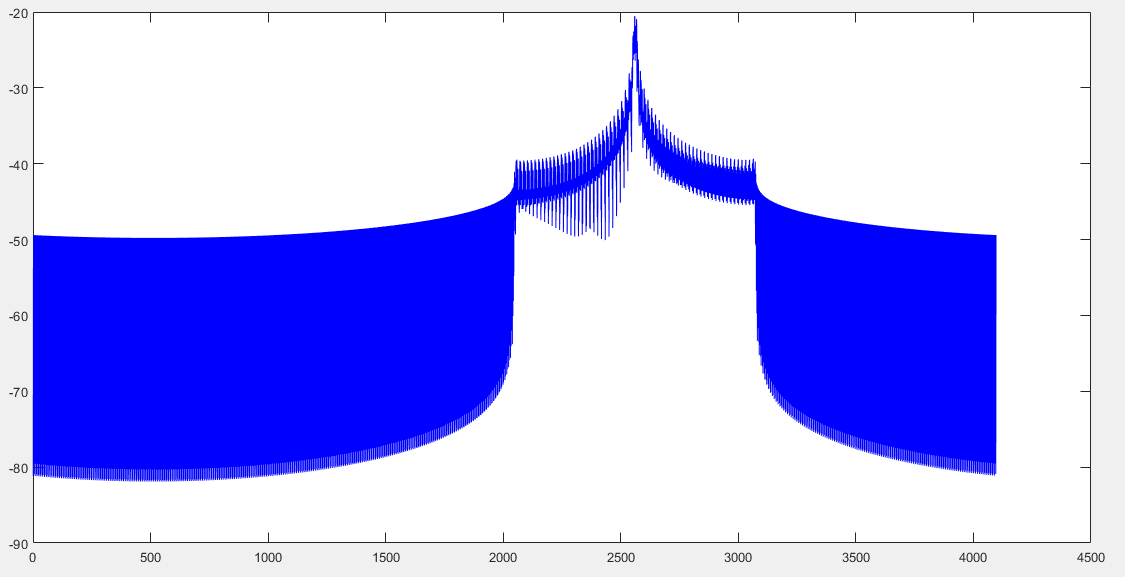
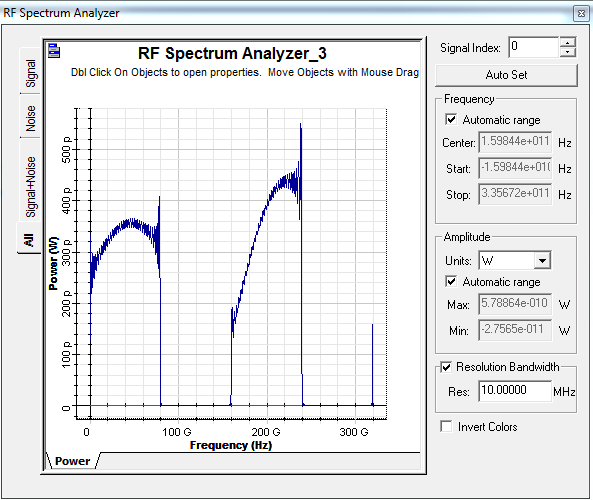
When i implement the system in Optisystem (see figure2), i get two shape of spectrum, the first one was displayed with the plot command of the OutputPort1.Sample.Signal in MATLAB command window (see figure3) and the other one is draw in RF spectrum analyzer (figure4).
So in Optisystem i get two different spectrum for the same signal which are different to the good spectrum shape in figure1.
Can you Help me please !!!
Many thanks
Attachments:
Categories
- All
-
Knowledge
Contains a detailed Q&A knowledge base. -
General
All non-technical questions. -
System
Optical system design and analysis. -
Instrument
Communicate and control different kinds of instruments. -
SPICE
Opto-electronic circuit design. -
FDTD
Finite-Difference Time-Domain simulation. -
BPM
Beam Propagation Method analysis and design. -
Grating
Fiber optic grating simulation. -
Fiber
Optical fiber design and characterization. -
Exchange
Users can exchange design files.
(Matlab, C++, etc.)