
Home › Forums › FDTD › Increasing data points in optiFDTD › Reply To: Increasing data points in optiFDTD
July 12, 2014 at 6:22 pm
#12361
Hi Damian,
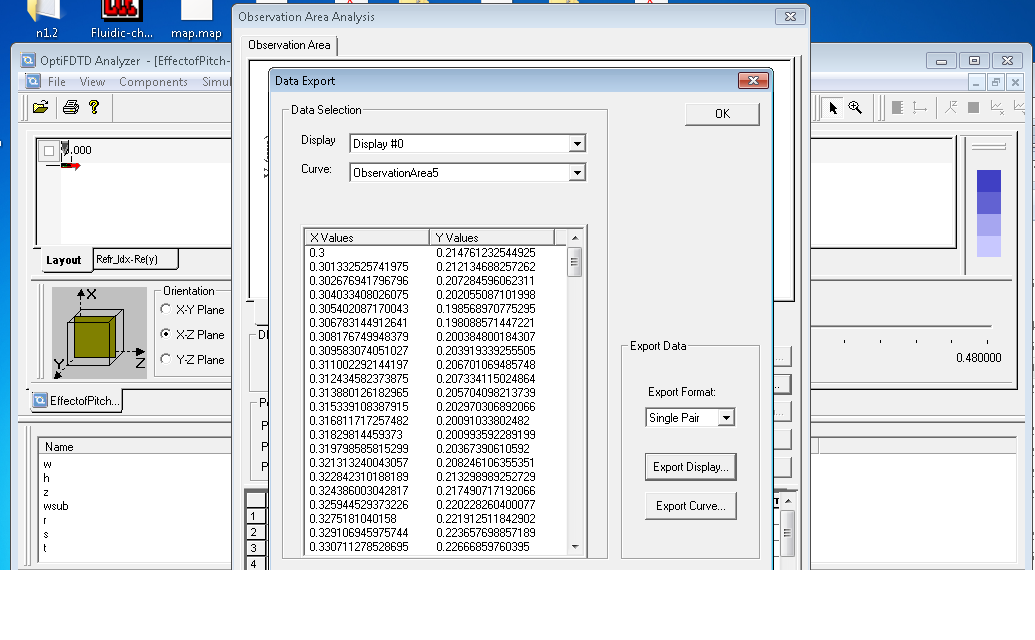
Thanks for your response. yes, I am using observation area, and I click on power spectrum calculation to get the transmission versus wavelength curve as in the attached file. When I export the data, please see attached file, the first wavelength is 0.3, then the second wavelength is 0.301; How can I get more data points so my first wavelength is 0.3, and the follwing point is at 0.3001 so I get a curve with a higher resolution. In other words, is there any simulation parameter that I can change to get more wavelength points on the wavelength axis؟
Attachments:
Categories
- All
-
Knowledge
Contains a detailed Q&A knowledge base. -
General
All non-technical questions. -
System
Optical system design and analysis. -
Instrument
Communicate and control different kinds of instruments. -
SPICE
Opto-electronic circuit design. -
FDTD
Finite-Difference Time-Domain simulation. -
BPM
Beam Propagation Method analysis and design. -
Grating
Fiber optic grating simulation. -
Fiber
Optical fiber design and characterization. -
Exchange
Users can exchange design files.
(Matlab, C++, etc.)