To view the simulation results in OptiBPM_Analyzer, perform the following procedure.
| Step | Action |
| 1 | To view and analyze the optical field view, in the directory in
OptiBPM_Analyzer, double-click Optical Field Propagation. |
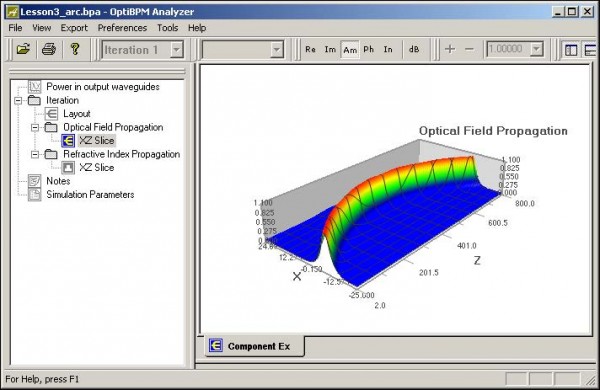
| 2 | Click XZ Slice.
The optical field view of the simulation results appears (see Figure 27). |
Figure 27: OptiBPM_Analyzer — Optical Field Propagation
| 3 | To view and analyze the refractive index view, in the directory in
OptiBPM_Analyzer, click Refractive Index Propagation. |
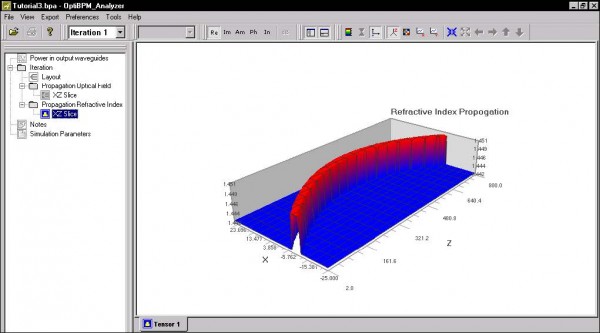
| 4 | Click XZ slice.
The refractive index view of the simulation results appears (see Figure 28). |
Figure 28: OptiBPM_Analyzer — Refractive Index Propagation
| 5 | To view the graph of the power in the output waveguide, click Power in
output waveguides. The graph appears in the layout window. |
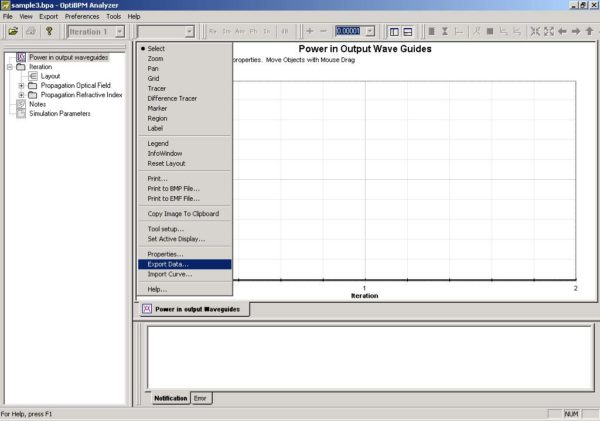
| 6 | In the top left corner of the layout window, click the blue Graph Menu icon.
A context menu appears (see Figure 29). |
Figure 29: Export Data
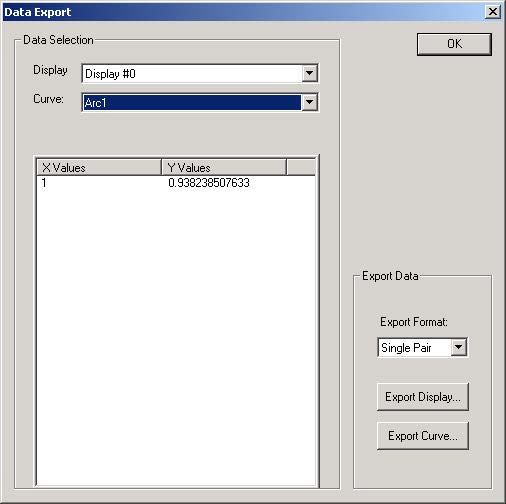
| 7 | Select Export Data.
The Data Export dialog box appears (see Figure 30). |
Figure 30: Power in output waveguides — Data Export dialog box


