This lesson applies the results from SOA gain saturation—Gaussian pulses to analyze the possibility for compression of weak picosecond pulses. As mentioned in SOA gain saturation—Gaussian pulses, one of the main results of the gain saturation induced self-phase modulation in SOA is the formation of positive chirp of the pulse in the process of amplification. Using the theory of propagation of phase modulated optical signals in dispersive medium [1], we know that, depending on the signs of the chirps of signal and the chirp of the dispersive medium, different scenarios are possible.
For equal signs of chirps, the dispersion effect is amplified. In the case of different signs of the chirps, the effect of pulse dispersion can be reduced, effectively leading to pulse compression. To use the positive chirp created in the process of pulse amplification in SOA for compression, we have to propagate the pulse with the dispersive media that creates negative chirp. The media can be standard mode optical fiber used for wavelengths larger than the zero dispersion wavelength — in other words, in the region of anomalous group velocity dispersion. This idea has been proposed and realized in [2]. In this lesson, we will use our SOA component to try to interpret the results obtained in [2].
The following SOA parameters are used in [2]:
Unsaturated single pass gain G0 ~ 30 dB
Line width enhancement factor α = 5
Saturation energy Esat ~ 6 pJ
Ratio Ein / Esat varied over the range 0.01 to 0.2
A typical value for the carrier lifetime is 200 – 300 ps. We consider pulses with the condition T0 / Tsat << 1 to be valid. We expect the appearance of effects connected to the gain saturation-induced self-phase modulation using these general conditions.
To analyze this situation, we use following global parameters:
- Bit rate B = 40 Gb/s → TB = 25 ps.
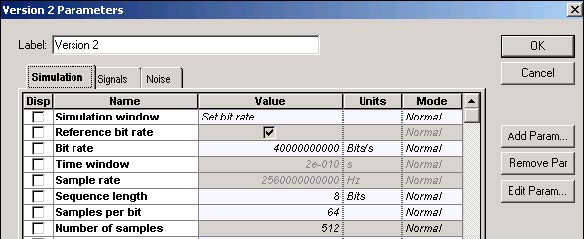
We consider pulses with TFWHM = 25 ps → T0 ~ 15 ps. Figure 1 shows the global parameters.
Figure 1: Global parameters
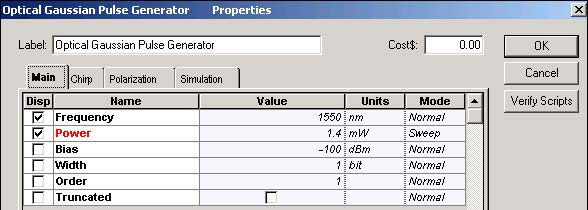
Figure 2 shows the Optical Gaussian Pulse Generator Main parameters.
Figure 2: Optical Gaussian Pulse Generator Main parameters
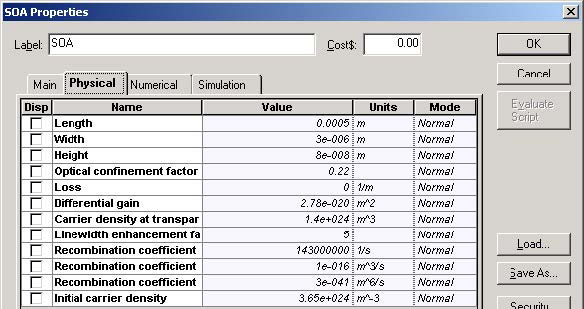
According to the default values of the SOA component, the carrier lifetime is tC ~ 1.4 ns and the saturation energy is Esat ~ 5 pJ. Figure 3 shows the SOA Physical parameters.
Figure 3: SOA Pulse Compression Physical parameters
To satisfy the conditions T0 / Tsat << 1 and Ein / Esat ~ 0.01 to 0.2, we can use the Gaussian pulse with T0 ~ 15 ps with T0 / Tsat ~0.011 and initial peak pulse powers are 3 mW, 30 mW, and 60 mW (which correspond to Ein / Esat = 0.01, 0.1, and 0.2 respectively).
Dispersion length LD in standard mode fiber (D ~16 ps /nm.km) for pulse with T0 ~ 15 ps will be LD ~ 11 km.
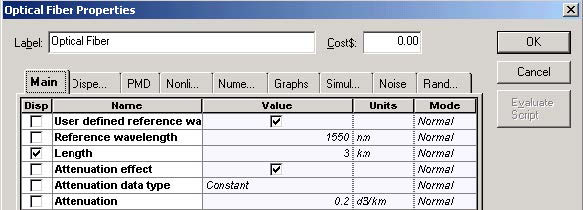
Figure 4 shows the Optical Fiber main parameters.
Figure 4: Fiber Main parameters
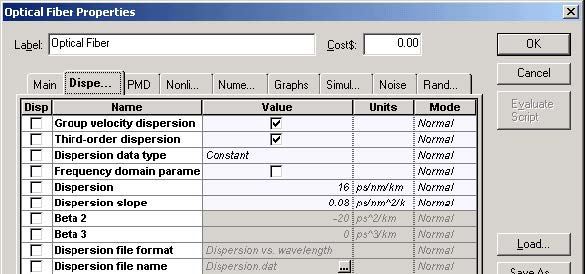
Figure 5 shows the Optical Fiber dispersions parameters.
Figure 5: Fiber Dispersions parameters
To satisfy the condition LC / LD ~ 0.3 given in [1], where LC is the length of the fiber used for compression the LC ~ 3.3 km has been used.
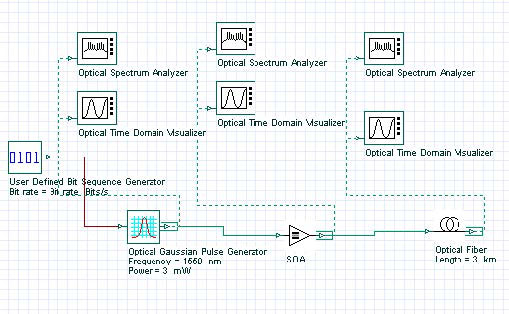
Figure 6 shows the SOA Pulse Compression project layout.
Figure 6: SOA Pulse Compression project layout
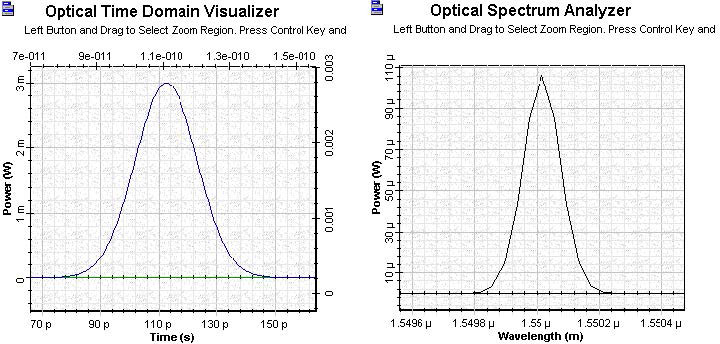
Figure 7 shows the initial pulse shape and spectrum with TFWHM = 25 ps and with the initial peak pulse power of 3 mW.
Figure 7:Initial pulse
Figure 8 shows the shape (with corresponding positive induced chirp) and spectrum of the amplified pulse with SOA where G0 = 30 dB and the line width enhancement factor is α = 5.
Figure 8: Amplified pulse
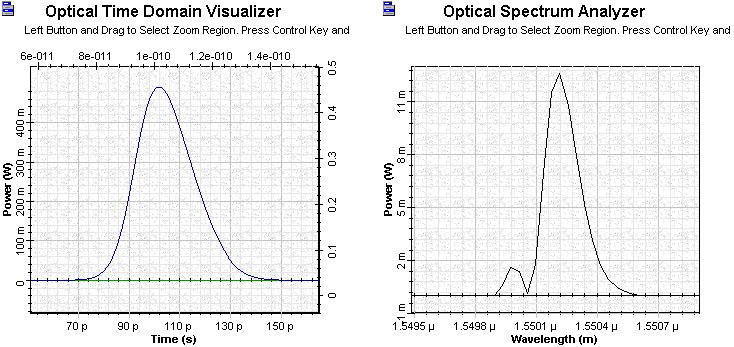
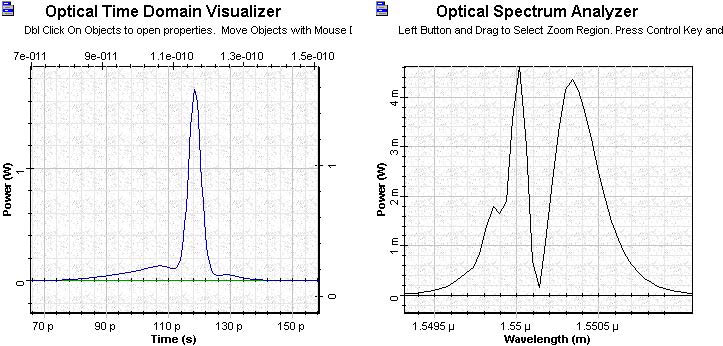
Figure 9 shows the shape and spectrum of the amplified pulse passed through a 3 km standard mode fiber.
Figure 9: OTDV and OSA amplified pulse passed through 3 km standard mode fiber
The comparison of the width of the pulse after the fiber shows a compression factor of about 7 times with the peak power enhanced by a factor of several hundreds. There are two important physical facts regarding the last shape figure.
- There is a broad pedestal on the leading side of the pulse, which can be explained by the negative chirp in the leading part of the pulse. This leads to increased dispersion of this part of the pulse.
- Regarding the shift of the pulse towards later times — sequence from the red shift of central frequency of the amplified pulse in anomalous group velocity dispersion leads to time delay of the pulse.
As mentioned in [2], the compression factor depends on several input parameters, such as the pulse energy, pulse width, amplifier gain, and compressor length. For non-optimal parameters, another type of phenomenon may occur (for example, pulse breaking).
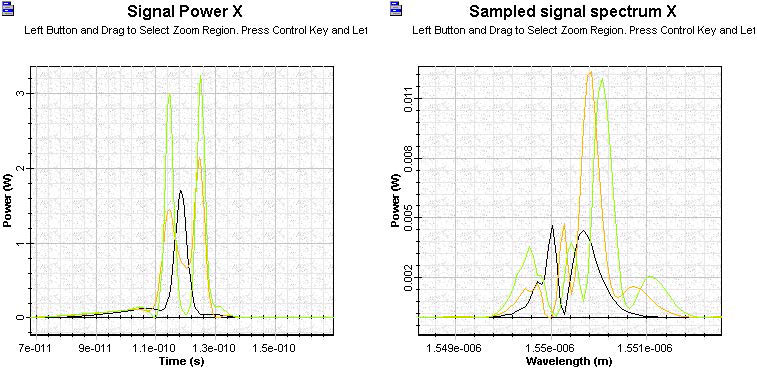
Figure 10 shows the pulse shapes and spectra with the initial peak powers of 3 mW, 30 mW, and 60 mW.
Figure 10: Shape and spectra of pulses with 3, 30, and 60 mW peak power
Figure 10 shows that a larger input peak power can lead to pulse breaking phenomenon with connected complicated spectra structure.
This lesson demonstrated the pulse compression of weak pulses (peak energy smaller than pJ) based on the use of the gain saturation-induced self-phase modulation effect in SOA.
References
[1] G.P. Agrawal, “Nonlinear Fiber Optics,” 3rd Edition, Academic press, 2001.
[2] G.P. Agrawal and N.A. Olsson, “Amplification and compression of weak picosecond optical pulses by using semiconductor laser amplifier”, Optics Letters, Vol. 14, pp. 500-502, 1989.


