Bidirectional Fiber and Raman Design
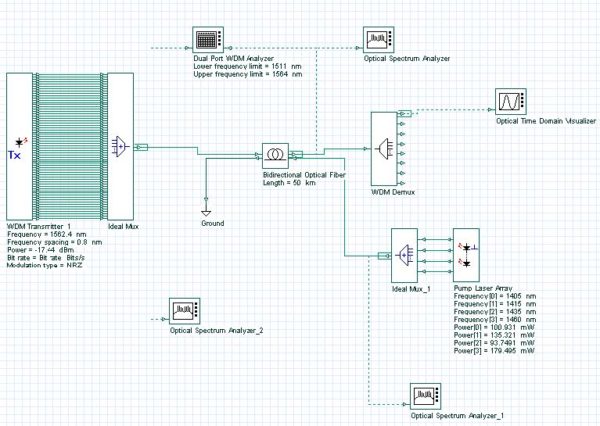
The objective of this lesson is to demonstrate a distributed Raman fiber design. Initially, the system described in Figure 1 was designed. The system consists of 64 channels at 10 Gbits/s propagating for a 50 km SMF-28 fiber. The attenuation in the fiber is compensated by the Raman amplification due to the 4 backward laser…
Modulation Formats

The first step in the design of an optical communication systems is to decide how the electrical signal should be converted into an bit stream. There are two typical choices for the modulation format of the signal: return-to-zero (RZ) nonreturn-to-zero (NRZ) Examples of the modulation formats are shown in Figure 1. Figure 1: Modulation Formats…
Extracting the Thermal Noise Parameter for a Specific Receiver Sensitivity

In this tutorial, we provide a basic example of Goal Attainment optimizations. In this example we will use the optimization tool in the context of parameter extraction. Thermal noise parameter of PIN will be extracted to get a receiver sensitivity of -17 dBm. The design layout is shown in Figure 1. The transmitter power is…
Receiver Noise—PIN
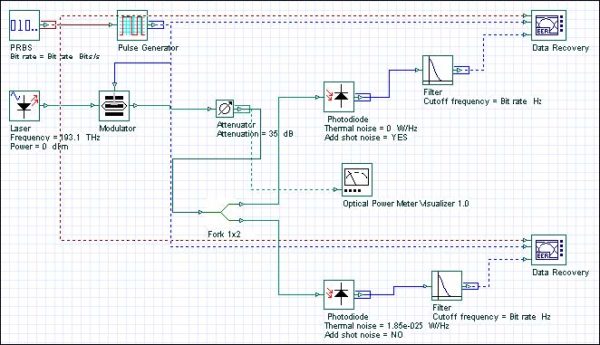
There are two fundamental noise mechanisms in a photodetector: shot noise thermal noise Receiver Shot and Thermal noise.osd details the signal degraded by thermal and shot noise in the PIN photodetector. The low-pass filter has a cutoff frequency with the same value as the bit rate. Figure 1: Receiver Shot and Thermal noise The upper…
Receiver Noise—Shot Noise Enhancement with APD
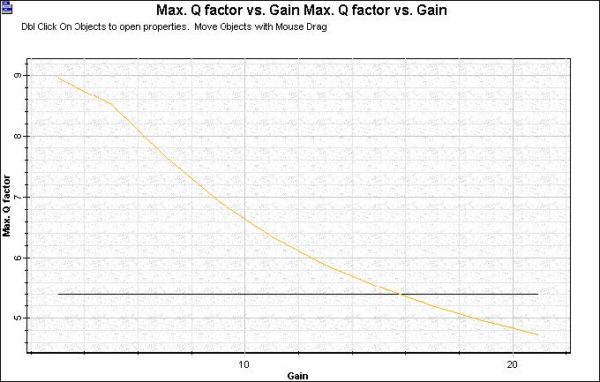
Optical receivers with APD generally provide a higher SNR for the same incident optical power. The improvement in the SNR is due to the internal gain that increases the photocurrent by the multiplication factor M. Figure 1: Receiver PIN x APD The APD photodetector systems (see Figure 2) has a Q factor higher that the…
Receiver Sensitivity—Bit Error Rate (BER)
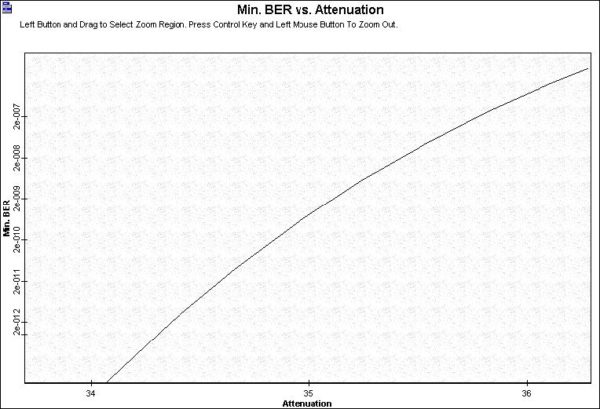
The performance criteria for digital receivers if governed by the bit-error-rate (BER), defined as the probability of incorrect identification of a bit by the decision circuit of the receiver. Receiver BER – Q factor.osd shows the BER and Q factor at the data recovery stage for different values of input power. Receiver BER – Q…
Receiver sensitivity—Minimum input power

This example shows the minimum optical power that a receiver needs to operate reliably with a BER below a specific value (see Figure 1). In this example, you calculate this input power by targeting a BER of 10-9, a Q factor equal to 6 for a PIN photodetector, and an APD. Figure 1: Receiver Min.…
Sensitivity degradation—Extinction ratio
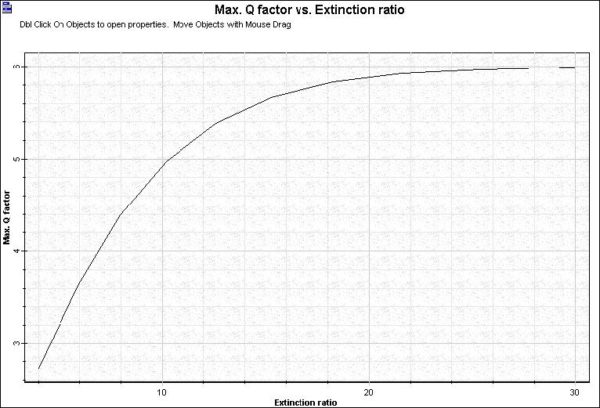
A simple source of power penalty is related to the energy carried by 0 bits. Some power is emitted by transmitters even in the off-state. Sensitivity Degradation – ER.osd includes an external modulated laser where you can specify the extinction ratio at the modulator (see Figure 1). Figure 1: Sensitivity Degradation – ER In this…
Signal degradation – Jitter

Jitter is defined as the short-term variations of a digital signal’s significant instants from their ideal positions in time. Significant instants could be (for example) the optimum sampling instants. Project Signal Degradation – Jitter.osd (Figure 1) demonstrates the setup for the ‘Electrical Jitter’ component. It requires an electrical signals and the clock signal from the…
Electrical PLL

The system demonstrates an electrical phase-locked loop. Sample: EPLL.osd The layout presented in the figure below is PLL system configured with a phase detector, a low pass filter and a voltage controlled oscillator. This example shows the response of a PLL to a sequence of pulses modulated in frequency to an electrical carrier at 1GHz.…
Analysis of Gain and Noise in Erbium doped fiber
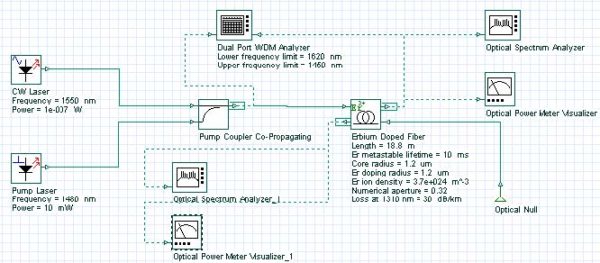
This lesson demonstrates the performance of an amplifier (gain and noise) based on Giles and Desurvire [1] reference. Figure 1: Layout of the system considered in the analysis of gain and ASE The characteristics of noise and gain presented in Figure 4.b [1] are reproduced through the system shown in Figure 1. Figure 2 shows…
Optimizing the EDFA gain for WDM lightwave systems
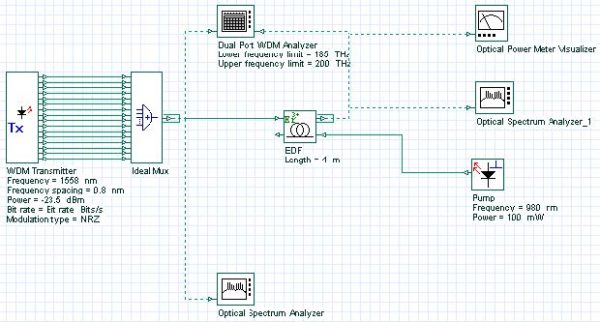
In this tutorial, we provide an example of the gain flatness optimization type. The gain of the EDFA will be flattened by optimizing the fiber length and pump power. One difficulty in implementing a WDM system including EDFA’s is that the EDFA gain spectrum is wavelength dependent. This effect results in SNR differential between channels…
Excited state absorption impact on EDFA performance
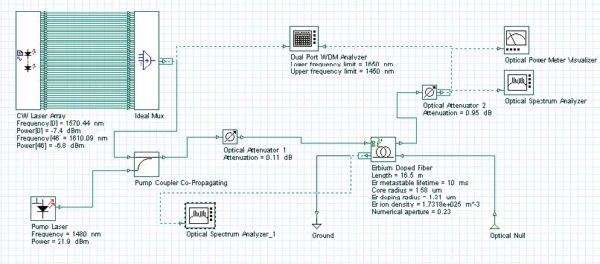
This lesson shows the influence of signal excited-state absorption (ESA) on the performance of an EDFA. The effect of signal ESA happens because a signal photon is absorbed by an erbium ion in an excited state, thereby promoting it to an even higher energy state and causing degradation in the amplifier efficiency. This effect is…
Ion-ion interaction effects
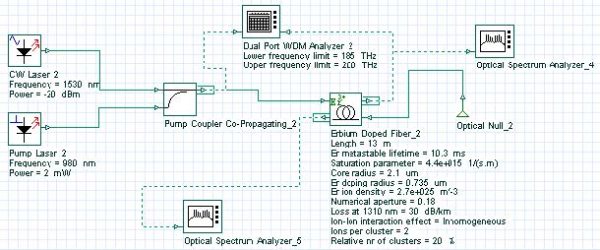
This lesson demonstrates two of the ion-ion interaction effects on EDFAs: homogeneous upconversion effect (HUC) inhomogeneous pair-induced quenching (PIQ) As explained in the technical description, the ion-ion interaction effects relate to the issue of energy transfer between rare earth ions. When the local concentration of rare ions becomes high enough, it is no longer valid…
Rayleigh backscattering in EDFA
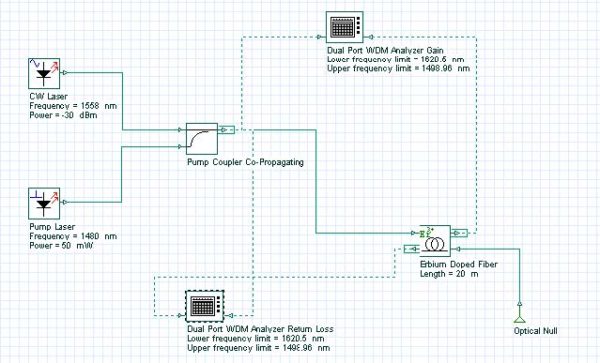
This lesson demonstrates the Rayleigh backscattering effect in the EDFA. The backscattering from an EDFA exceeds backscattering from an equivalent length of a non-doped fiber. Because Rayleigh backscattering can cause degradation in the EDFA performance [1], this effect has to be considered in the simulations to give better accuracy in the results. The EDF component…

