Simulation Parameters

Step Action 1 From the Simulation menu, select Simulate 3D Using 64-bit Simulator. The 3D Simulation Parameters dialog box appears (see Figure 1).3D simulation parameters dialog box Figure 1: 3D Simulation parameters dialog box 2 Type the following values for the mesh size: Mesh Delta X (mm): 0.07 Mesh Delta Y (mm): 0.07 Mesh Delta Z…
Post-Simulation Data Analysis
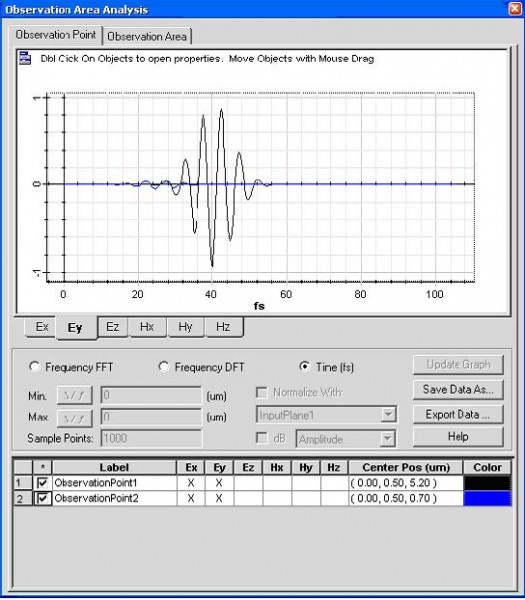
Our Analyzer provides a number of tools allowing for evaluation simulation results. Observation Point Step Action 1 Select “Observation Area Analysis” under the “Tools” menu in the Analyzer. Observation Point dialog box appears 2 To observe the time domain response in the observation point, check the observation point object, select the field components button, and…
Refractive Index
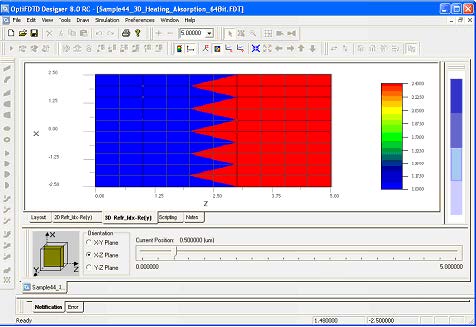
Step Action 1 Click on “3D_Ref_Idx-Re(y)” tab on the bottom of the layout frame or select “Refractive Index” in the View menu. View of the refractive index cross-cut slice appears. 2 In the Orientation region which is in the left-bottom area of the window, change the slice orientation and move the slice position to observe…
Observation Objects
For the 32-Bit FDTD simulation, observation objects will record the entire time domain response so that spectrum analysis can be performed in analyzer. For 64-Bit FDTD simulation, Observation Points will still record the time domain response in each single point, but Observation Area will perform the spectral analysis during the simulations and save the resulting DFT…
64-bit FDTD Simulation
Step Action 1 From the Simulation menu, select the “Simulate 3D using 64-Bit Simulator…” option. The 3D Simulation Parameters dialog box appears. 2 Click Run to start the simulation. The progress window appears, it displays the status of the simulations. 3 Visualization of intermediate simulation results. • When the Simulation Process window appears, from menu, select…
Post-Simulation Data Analysis

Our Analyzer provides a number of tools allowing for evaluation of different simulation results. The Heating absorption can be evaluated only in the Observation Area. Step Action 1 Open results file by analyzer. 2 In the Tools menu, select Observation Area Analysis to open the dialog box. 3 Click on the Observation Area button to…
2D TF/SF Simulation and RCS Detection Introduction
2D Total Field/Scattering Field (TF/SF) is a special excitation type that excites arbitrary tilting plane wave in the enclosed rectangular surface. Inside the rectangular region, it generates the total field. Outside of this rectangular region, it is the pure scattering field. TF/SF simulation enable RADAR cross Section analysis. Complex grating layout analysis and other plane wave…
New Layout
Step Action 1 Open OptiFDTD Waveguide layout Designer From the Start menu, select Programs ->Optiwave Software -> OptiFDTD-> Waveguide Layout Designer. OptiFDTD_Designer window opens. 2 Create a new project. From the OptiFDTD_Designer File menu, select New. The Initial Properties dialog box appears. 3 Define the material(s) and waveguide profile(s) that will be used in the project.…
Input Wave
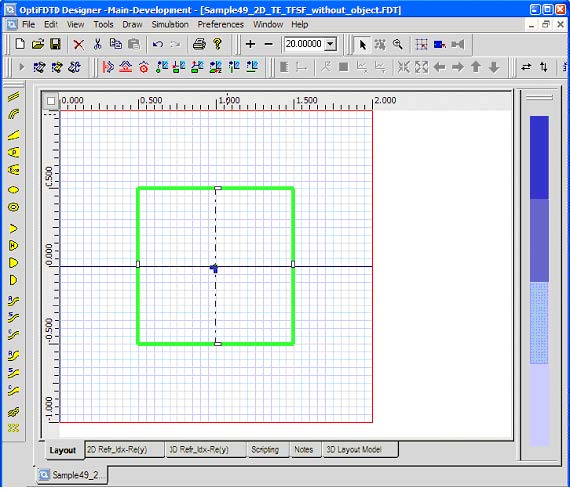
To insert the TF/SF plane wave excitation follow the steps below: Step Action 1 From the Draw menu, select TFSF region. 2 Click in the layout window at the position where you want to insert the TFSF region. A Green/red rectangular region that represents the TFSF appears in the layout window. (Figure 9) Figure 9: Initial…
Simulation Parameters
Step Action 1 From the Simulation menu, select 2D 32bit Simulation Parameters. Simulation parameters dialog box appears 2 Select TE as the 2D simulation type 3 Turn off the auto check for Mesh Delta. Type the following values for the mesh size: Mesh Delta X (um): 0.01 Mesh Delta Z (um): 0.01 4 To set…
32-bit FDTD Simulation
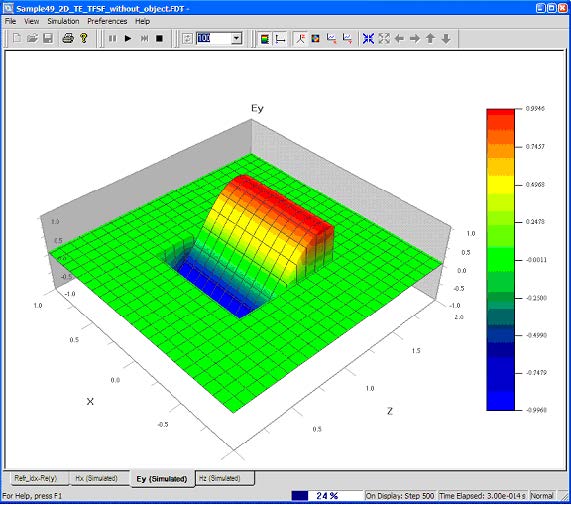
Step Action 1 From the Simulation menu, select the “2D 32bit simulation parameters“ 2 Click Run to start the simulation. The Simulator window appears (Figure 14). It displays the time domain response for TFSF excitation. Figure 14: 2D Simulator window When Simulation is finished, you will be asked if you want to open the analyzer…
Steady State Response
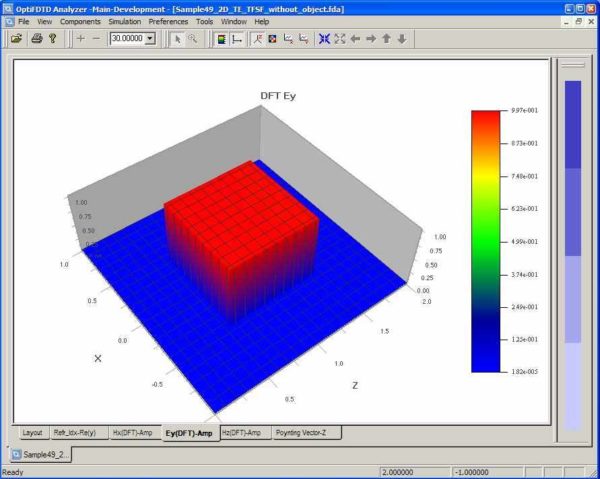
Step Action 1 In the analyzer window, Click Ey(DFT) AMP button under the graph window to observe the steady state response for this TFSF excitation in free space (Figure 15). 2 Click Hx(DFT) AMP button or Hz(DFT) AMP button to Observe other field components. 3 In the Components menu, click field components and select phase…
RCS Calculation for an Infinity Cylinder
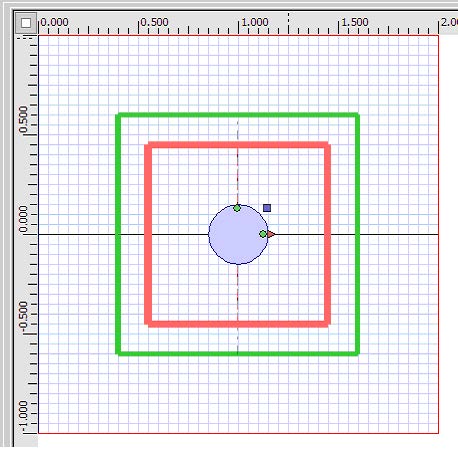
Step Action 1 Re-open this layout in the OptiFDTD Designer. 2 Select “Elliptic Waveguide” under the Draw menu, or select the Elliptic Waveguide in the shortcut toolbar. 3 Left-click and do not release the mouse to draw an elliptic waveguide in the layout. release the mouse by clicking the arrow toolbar. 4 To adjust the position…
3D Surface Plasmon Introduction
Surface plasma wave is sensitive to the metallic material and the layout geometries. OptiFDTD provided build in time domain Lorentz_Drude for noble metals. In the following we will discuss two surface Plasmon layout simulations. Note: The samples in this lesson will only run on a 64-bit computer.
Nano-Gold Particle
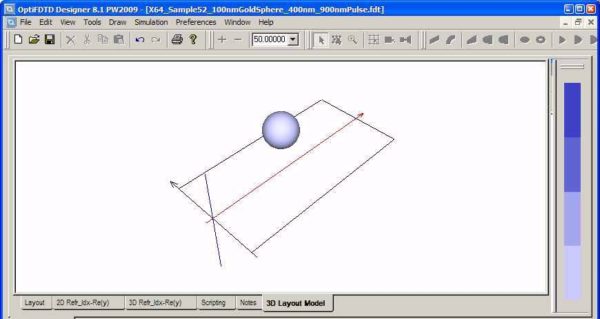
In this example, we will show how a gold particle is simulated by OptiFDTD. In some surface Plasmon layouts, gold particles may distribute in an array format, if the input plane wave propagate straight forward and the array is periodic, then we can take one periodic cell for the simulation with transverse boundary set as…

