In this example, we will show you how to simulate a simple single-mode optical fiber
that is optimized for use in the 1310 nm wavelength region. The main features of
OptiFiber will be addressed in this example. You can find this example as the SMF-
28.fcd file in the Samples directory.
Defining fiber profile
To define a fiber profile, follow these steps:
| Step | Action |
| 1 | From the “File” menu click “New” to open a new project. |
| 2 | 2. Click the “Fiber Profile” icon in the “Navigator” pane. |
| 3 | 3. In the “Select Profile Type” dialog box click “Refractive Index Profile” |
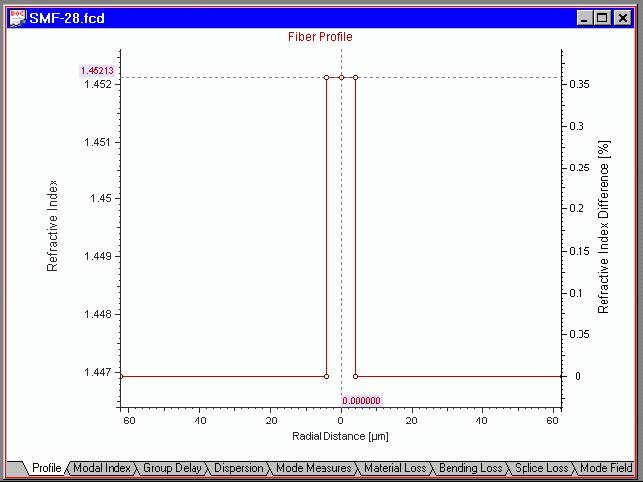
| 4 | 4. In the “Fiber Profile” dialog box add two regions: “Region 0” and “Region 1”For “Region 0”, enter the following data: Width: 4.15 Profile: constant Index: 1.45213 Click “Apply” For “Region 1”, enter the following data: Enter the wavelength value 1.3 microns. Your fiber profile should look like the one below: |
Note that both the absolute values of the reference indexes and the normalized
difference Δ are shown.
Defining dispersion models
To define a dispersion model, follow these steps:
| Step | Action |
| 1 | In the “Fiber Profile” dialog box, select “Define” in the “Material Properties” group of controls. |
| 2 | In the “Material Properties” dialog box, select “Define” in the “Host” section. |
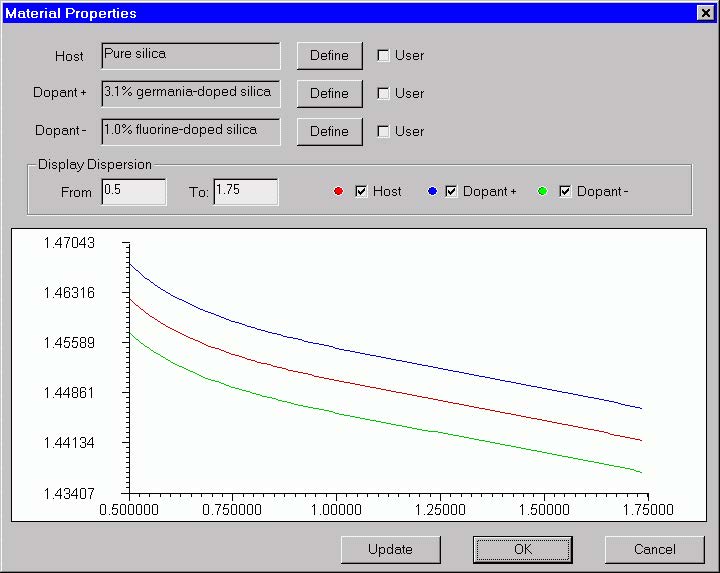
| 3 | In the “Parameters of Material” dialog box, select “Pure Silica” from the library and press Get, followed by pressing OK to close the “Parameters of Material” dialog box. You can see in the “Material Properties “ dialog box that the host material is now “Pure Silica”. |
| 4 | Similarly as in the previous step, define 3.1% germanium-doped silica for the “Dopant+” material |
| 5 | Similarly as in the previous step, define 1% fluorine-doped silica for the “Dopant-“ material. Thus you defined two reference materials that will be used to calculate the material dispersion and the profile dispersion of the fiber. |
| 6 | Press OK in the “Material Properties” dialog box to close it. |
| 7 | Press OK in the “Fiber Profile” dialog box to close it. |
Your “Material Properties” dialog box looks like this:
Calculating fiber modes
To calculate a fiber profile, follow these steps:
| Step | Action |
| 1 | Click the “Modes” icon in the “Navigator” pane |
| 2 | Select the “LP Modes (Matrix Method)” option |
| 3 | Press “Recalculate Modes”. The program provides the modal index at the given wavelength and shows a preview of the modal field. |
| 4 | In the “Views” window, select the “Mode Field” tab to view the modal field. |
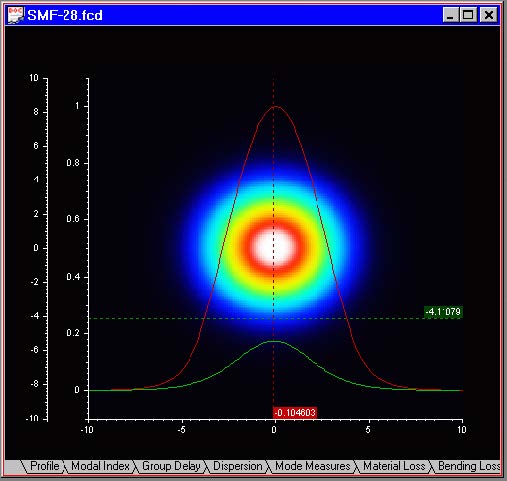
| 5 | From the “Graph Tools” toolbar select “X Cut”, then click-and-drag the cursor over the graph to inspect the mode field normalized “X-section”. The default color for “X Cut” lines is green. |
| 6 | From the Graph Tools toolbar select “Y Cut”, then click-and-drag the cursor over the graph to inspect the mode field normalized Y-section. The default color for “Y Cut” graph lines is red. |
When you click-and-drag the left mouse button inside your “Mode Field” view tab with
“X Cut” and “Y Cut” active, then the view looks like this:
Calculating cutoff wavelength
To calculate the cutoff wavelength, follow these steps:
| Step | Action |
| 1 | Click the “Cutoff” icon in the “Navigator” pane. |
| 2 | Select the “LP Modes (Matrix Method)” option. |
| 3 | Press “Recalculate”. The program shows guided modes on the list. If only LP01 is supported – decrease the wavelength. |
| 4 | Select the “LP11” mode on the list. |
| 5 | Press the Calc. “Cutoff” button. The program shows: — a “theoretical” cutoff wavelength value of 1.33204 microns. — a “ITU-T” compliant cutoff value of 1.231 microns. |
Calculating properties of fundamental mode
To calculate the properties of the fundamental mode, follow these steps:
| Step | Action |
| 1 | Click the “Scan Fundamental Mode” icon in the “Navigator” pane. |
| 2 | In the “Properties of Fundamental Mode” dialog box, select all available “Calculate” options |
| 3 | Leave the defaults for material, bending, and splice loss parameters |
| 4 | In the “Scan” section list, select “Wavelength”, which is also the default option. 68 |
| 5 | In the “Parameter” section, enter “From” = 1.2, “To” = 1.6, “Steps” = 100. |
| 6 | Click “Calculate”. |
Viewing results
You can inspect the output graphs in the Views window by selecting appropriate tabs:
- “Modal Index” tab: Plot of the modal index vs. the current scanning parameter, i.e. wavelength
- “Group Delay” tab: Plots the group delay vs. the scanning parameter.
- “Dispersion” tab: Plots material, waveguide and total dispersion vs. the scanning parameter. The zero dispersion wavelength and the slope are shown on the graph.
- “Mode Measures” tab: Plots the near-, far-field, effective mode field diameter and the effective mode area vs. the scanning parameter.
- “Material Loss” tab: Plots the material loss vs. wavelength.
- “Bending Loss” tab: Plots the micro and macro bending losses vs. the scanning parameter.
- “Splice Loss” tab: Plots the splice loss vs. the scanning parameter.
- “Eff. Nonlinear RI” tab: Plots the effective nonlinear refractive index of the fiber vs. the scanning parameter.
Simulating polarization mode dispersion
Birefringence
To simulate the birefringence, follow these steps:
| Step | Action |
| 1 | Click the “Birefringence” icon in the “Navigator” pane |
| 2 | In the “Birefringence” dialog box, check the “Induced by Perturbation Parameters” option. The “Photoelastic Constants” entries become available. |
| 3 | In the “Photoelastic Constants” section, enter: Young Modulus 7750000000, C 3.44e-011, Poisson Ratio 0.164. |
| 4 | In the “Induced by Perturbation” Parameters section, check “Extrinsic”, “Bending”, and “Fiber Spooled With Tension”. |
| 5 | Enter the “Bending” value 0.12 |
| 6 | Enter the “Fiber Spooled with Tension” value 0.5. |
| 7 | In the “Output” section, enter “Spectral Range” 0.4 and “Number of Steps” 51. |
| 8 | Press OK to close the “Birefringence” dialog box |
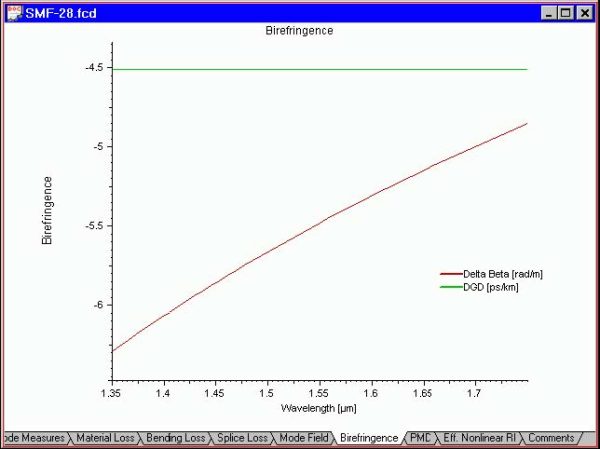
| 9 | Go to the “Birefringence” view tab. The birefringence and Differential Group Delay (DGD) vs. wavelength are plotted there. |
Your “Birefringence” view tab should look like this:
Polarization mode dispersion
To simulate the polarization mode dispersion, follow these steps:
| Step | Action |
| 1 | Click the “PMD” icon in the “Navigator” pane |
| 2 | Define the parameters for PMD simulation: Fiber Length 1000, Coupling Length 20. The Birefringence Characteristics are provided for your information and are disabled in this dialog box. |
| 3 | Choose “Spectral simulation”: Spectral Range 0.1, Number of Steps 201. |
| 4 | Press “OK” to close the polarization Mode dispersion dialog box and start the simulation. |
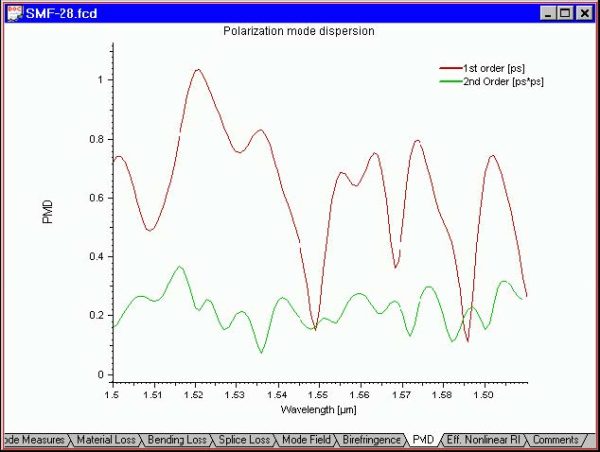
| 5 | Go to the “PMD” graphics tab. The first order and second order PMD vs. wavelength are plotted for spectral simulation. (For Ensemble simulation, the first order PMD vs. Number of Runs would be plotted). |
Your “PMD” view tab should look something like this:
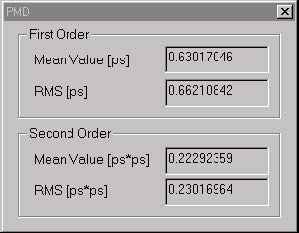
Also, you will have the mean value and the root mean square, (RMS value) of the first
and second order PMD displayed in a separate window.
Performance Characterization
Here is the table that compares OptiFiber results with a typical fiber (Corning SMF-
28.):
| Characterized Parameter | Calculated Value | Typical value |
| Zero dispersion wavelength, λ0 | 1.309 μm | 1.302 μm < λ0 < 1.322 μm |
| Zero dispersion slope, S0 | 0.0856 ps/(nm2 *km) | <0.089ps/(nm2 *km) |
| Eff. MFD at 1310nm | 8.9 μm | 9.20 ± 0.4μm |
| EFF. MFD at 1550nm | 9.9 μm | 10.4 ± 0.5μm |
| Effective group index | 1.4676 | 1.4675 |
| Cut-off wavelength of LP11 | 1.23 μm | <1.260 μm |
The data of SMF-28 were taken from the public-domain specifications at Corning’s
web-site www.corning.com/opticalfiber/
Corning is a registered trademark and SMF-28 is a trademark of Corning
incorporated, Corning, NY, USA.

