Graph Tools

Using Graph Tools toolbar commands The Graph Tools toolbar contains commands frequently used in handling OptiFiber graphical views. They include such commands as Joints, Measure Distance, Tracking, Zoom X, Zoom XY, Zoom Off, Legend, Grid X, Grid Y, X Cut, and Y Cut. The Graph Tools toolbar commands are described in the Commands Reference sections:…
Navigator Pane

Using Navigator pane The Navigator pane provides quick access to the most frequently used commands. It contains icons that activate start the main dialog boxes of OptiFiber. These dialog boxes are used to enter data and run calculations. The Navigator options are described in the Commands Reference sections: Fiber Profile Command Modes Command Fundamental Mode…
Views Window
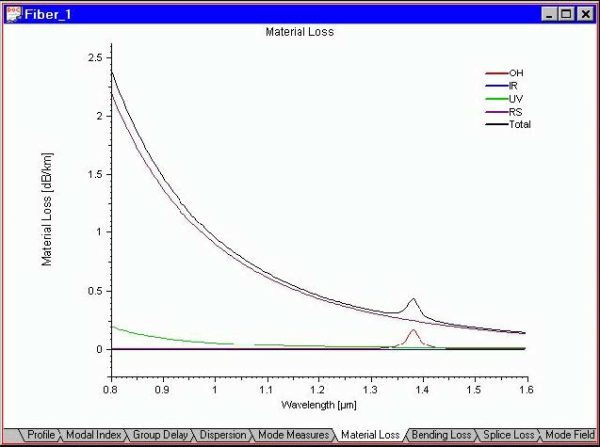
The Views window provides all graphical output from simulations. The graphs appear in the view tabs as they are calculated. In a new file, most views are empty, except the Material Loss tab, where a default loss characteristic is displayed. The list of available view tabs is as follows: Profile view Modal Index view Group…
Managing Projects
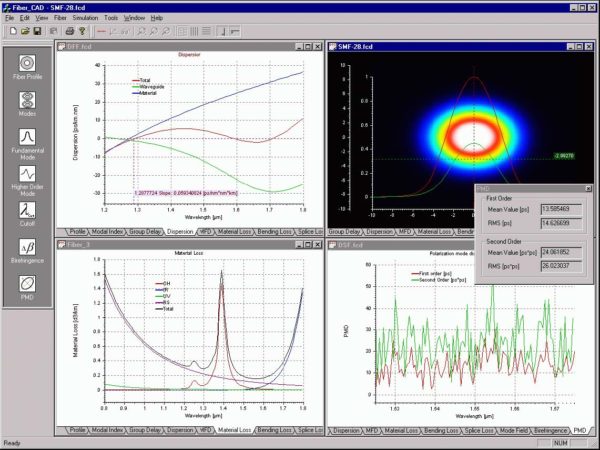
You can open and work with many projects files using the same OptiFiber workspace. Different output view windows represent the project files. OptiFiber generates default titles to newly opened files, for example Fiber 1, Fiber 2, etc. It is convenient to tile several projects for the purpose of comparison. The simulation commands always refer to…
Fiber Profile
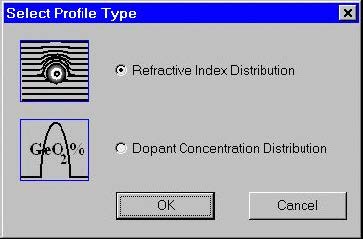
Designing a fiber profile The process of designing a new fiber usually starts by defining its profile. Click the “Fiber Profile” icon in the Navigator pane or double-click the workspace or select the “Fiber/Profile” menu item. Currently two types of profiles are supported: refractive index profile and dopant concentration profile. The “Select Profile Type” dialog…
Calculating Fiber Modes
After having defined the fiber profile the user can proceed with the calculations. Click the “Modes” icon in the “Navigator” pane. The “Modes” dialog box appears. To recalculate this example fiber profile do the following steps: Step Action 1 In the Mode Solver panel, check the LP Modes (finite difference method) option and leave the…
Fundamental Mode
Click the “Scan Fundamental Mode” icon in the Navigator pane. The “Properties of Fundamental Mode” dialog box appears. Do the following steps: Step Action 1 Press the “Calculate” button. The routines calculate all characteristics checked in the Calculate section. In the “Views” window, you can now see graphs of these characteristics. 2 Click the “Modal…
Higher Order Mode
If the current fiber design supports multiple modes their characteristics can be calculated the following way: Step Action 1 In the “Modes” dialog box recalculate and select the higher-order mode of interest. In that example of a typical 65/125 multi-mode graded-index fiber it is LP(3,6) Click the “High Order Mode” icon in the Navigator pane.…
Arbitrarily Selected Group of Modes
If the current fiber design supports multiple modes the characteristics of a group of modes can be calculated for comparison: Step Action 1 In the “Modes” dialog box recalculate and select the group of modes, in this case all the modes from LP(0,1) to LP(2,6) 2 Then proceed to the “Properties of High Order Mode”.…
Cutoff Wavelengths
Click the “Cutoff” icon in the “Navigator” pane. The “Cutoff” dialog box appears. Press “Recalculate” first to obtain the mode list. If the fiber is single-mode, reduce the wavelength value using the edit box with the same name (to 0.5 microns in the picture below). Two types of cutoff calculations are currently supported and respectively…
Birefringence
Click the “Birefringence” icon in the “Navigator” pane. The “Birefringence” dialog box appears. Step Action 1 In the “Birefringence” dialog box, check the “Induced by Perturbation Parameters” option. The “Photoelastic Constants” entries become available. 2 In the “Photoelastic Constants” section, enter: Young Modulus 7750000000, C 3.44e-011, Poisson Ratio 0.164. 3 In the “Induced by Perturbation”…
Polarization Mode Dispersion
Click the “PMD” icon in the “Navigator” pane. The “Polarization Mode Dispersion” dialog box appears. To execute the polarization mode dispersion calculations, leave the defaults and press “OK”. The program calculates the polarization mode dispersion and updates the “PMD” tab in the “Views” window.The “PMD” dialog box appears automatically showing numerical values related to the…
Joints
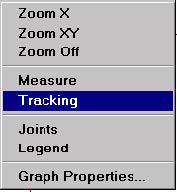
The “Joints” tool shows the actual calculated points of a curve. Do the following steps: Step Action 1 Select a tab in the “Views” window, for example the “Modal Index” tab. 2 Press the “Joints” button on the “Graph Tools” toolbar or, select the “Joints” item from the floating context menu, accessible by right clicking…
Zoom
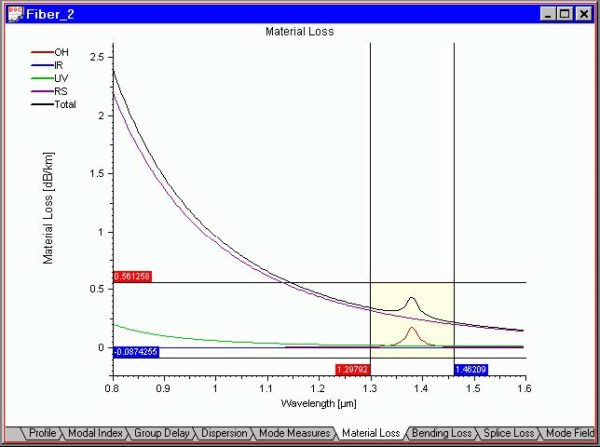
“Zoom X”, “Zoom XY” and “Zoom Off” are convenient tools for expanding a portion of the graph. “Zoom X” expands the view only in horizontal direction, “Zoom XY” – in both. Do the following steps: Step Action 1 Select, for example, the “Material Loss” tab in the Views window. 2 Select “Zoom XY” from the…
Measure
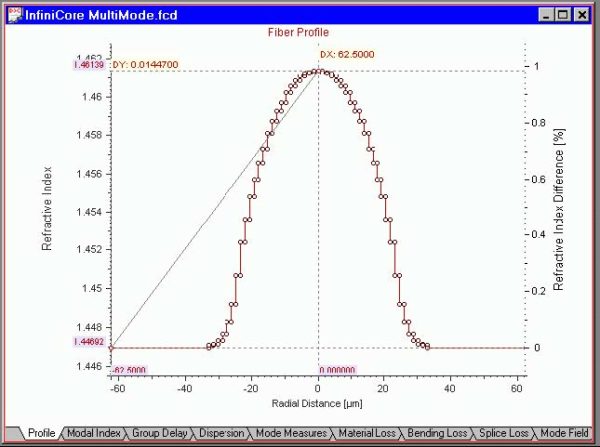
The “Measure” tool measures the difference between two points of the curve. Do the following steps: Step Action 1 Select, for example, the “Profile” tab in the Views window. 2 Select “Measure” from the “Graph Tools” floating menu or the “Graph Tools” toolbar. 3 With the left mouse button, click-and-drag to measure the coordinates’ difference.…

