
Home › Forums › SYSTEM › Generate Graph: Wavelength vs. Attenuation from Optical Fiber › Reply To: Generate Graph: Wavelength vs. Attenuation from Optical Fiber
September 17, 2020 at 9:18 am
#68126
Dear Martin,
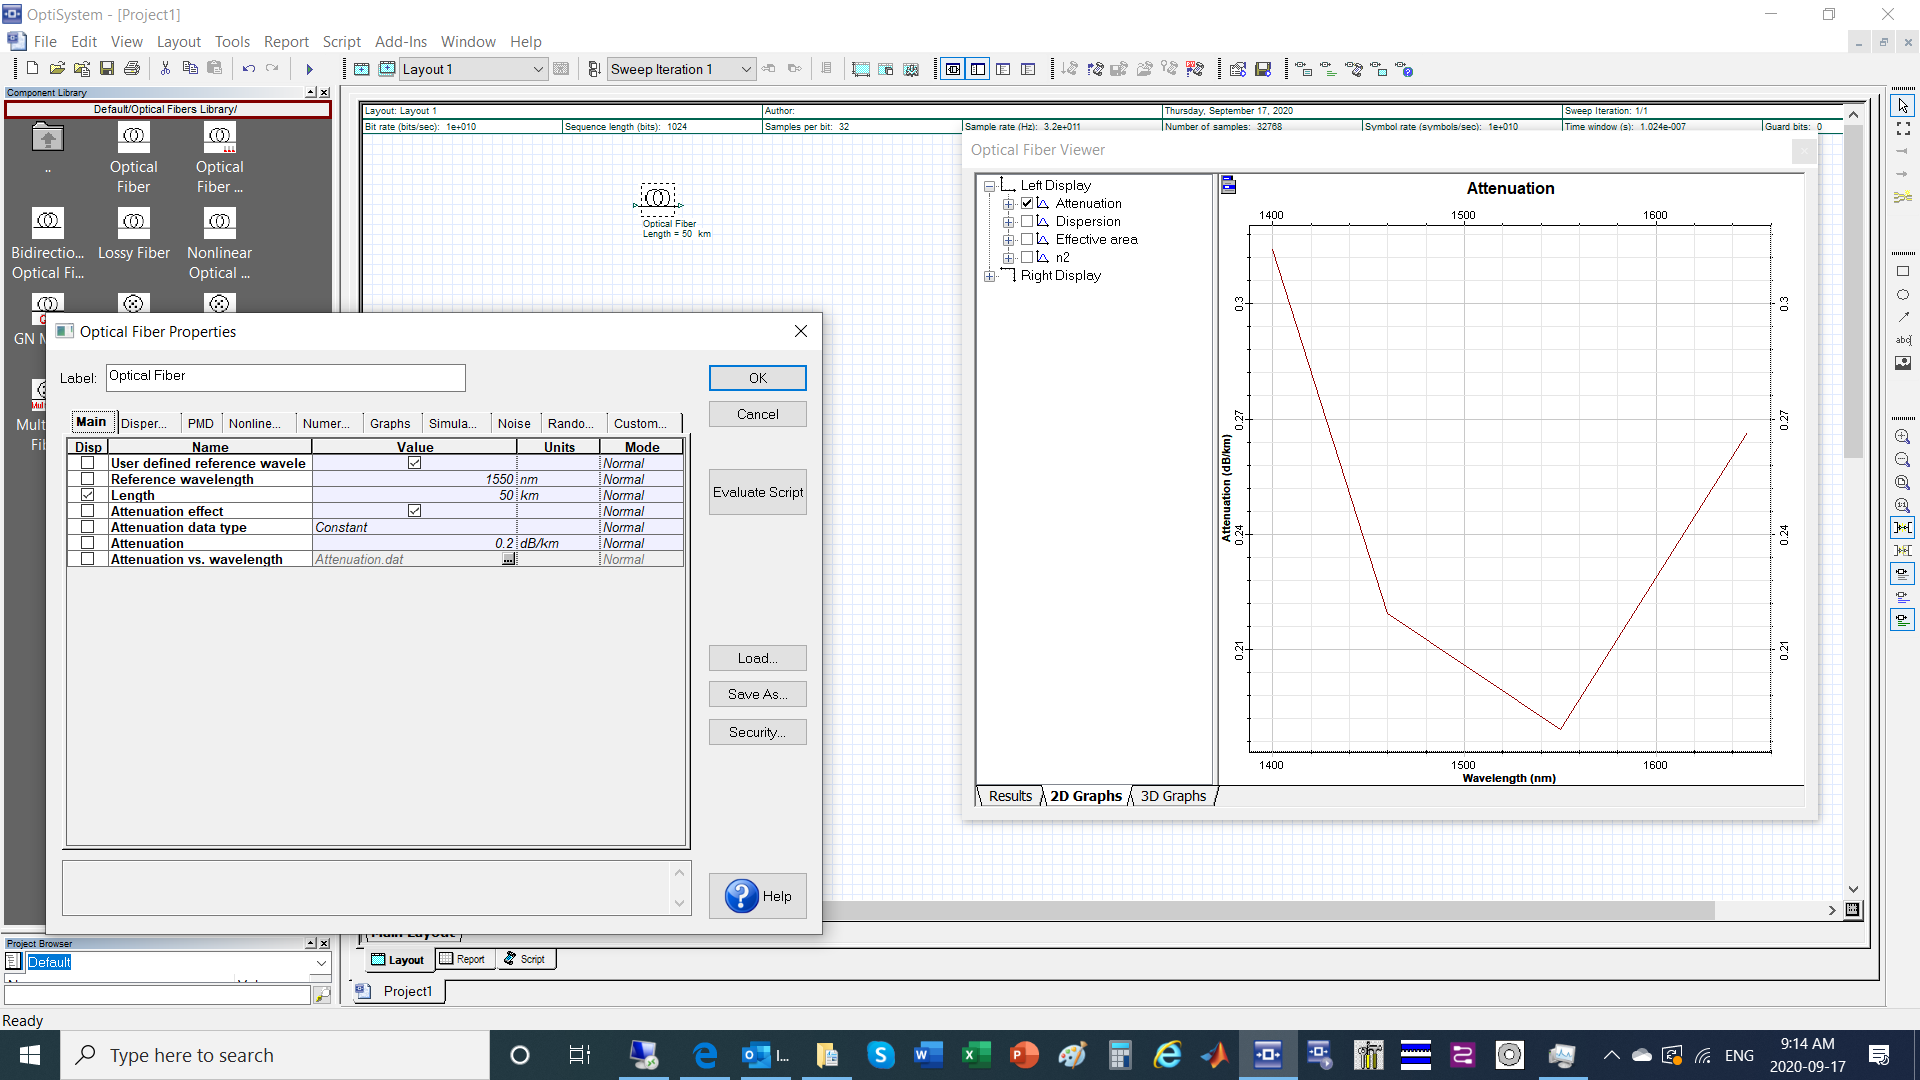
You may right click on the fiber component in OptiSystem and select Component View…, then choose 2-D Graphs and expand Left Display as shown in the attached graph to display the attenuation profile of the fiber. Please note that you can load your own attenuation profile or use the default profile which is shown in the image.
I hope this helps.
Regards,
Ahmad
Attachments:
Categories
- All
-
Knowledge
Contains a detailed Q&A knowledge base. -
General
All non-technical questions. -
System
Optical system design and analysis. -
Instrument
Communicate and control different kinds of instruments. -
SPICE
Opto-electronic circuit design. -
FDTD
Finite-Difference Time-Domain simulation. -
BPM
Beam Propagation Method analysis and design. -
Grating
Fiber optic grating simulation. -
Fiber
Optical fiber design and characterization. -
Exchange
Users can exchange design files.
(Matlab, C++, etc.)