When optical lens size is compatible with the working wavelength, the traditional lens analysis tools such as ray-tracing method will lose their accuracy. The FDTD method can be used to advantage in the nano-lens simulation. OptiFDTD software also provides tools so that beam focus size, focus distance, and far-field transform can be obtained directly. The following two samples show nano-lens simulations.
SMF28 fiber lens simulation
Layout Introduction
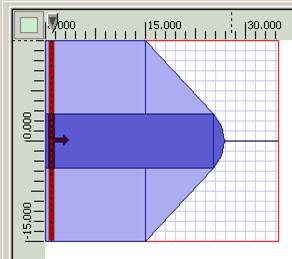
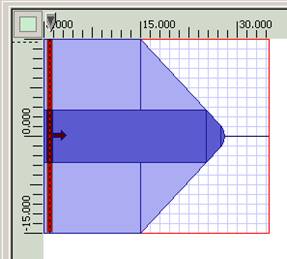
When fiber is tapered and polished in the termination as shown in Figure 1, a fiber lens can be created. The lens size can be exactly fiber’s core size or smaller than the core. In fact OptiFDTD can scan the lens size so that focus beam size and focus distance can be optimized.
Figure 1: SMF28 fiber lens (a) R=6 µm; (b) R=2.4µm
Related layout can be found in OptiFDTD sample folder with project name “Sample22_VBscript_2D_Lens.FDT”
Simulation results
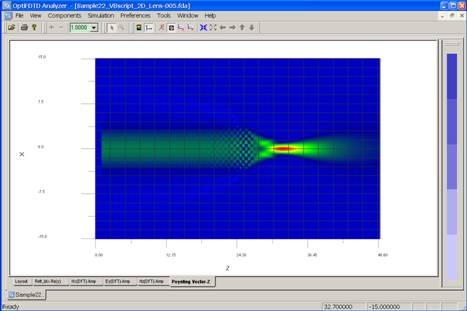
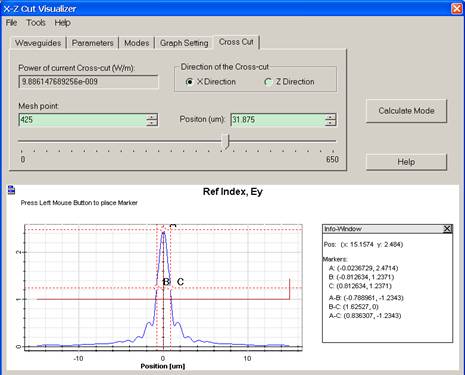
After the simulation, the field pattern and the Poynting vector can be plotted for each lens size (see figure 2), based on the field pattern, the beam size and the focus distance can be measured by the slice viewer (see figure 3)
Figure 2: Poynting vector for Fiber lens
Figure 3: Beam size measurement in OptiFDTD
Nano Lens Array
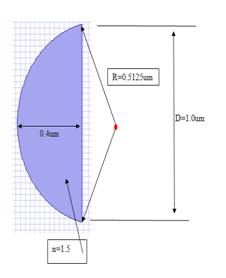
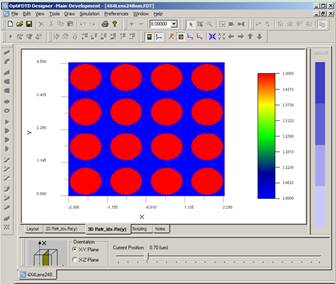
In this 3D sample, we discuss a micro-lens array, the lens dimension is marked in Figure 1, and Figure 2 is xy plane refractive index distribution.
Figure 1: Lens size
Figure 2: Top view of the lens Array
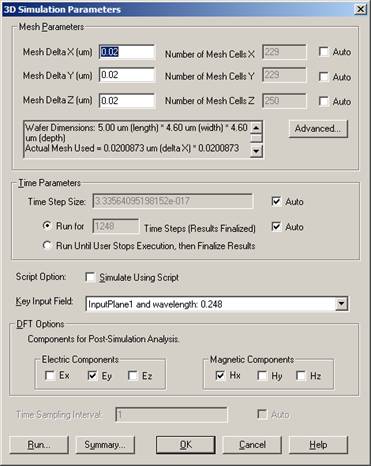
Simulation Parameters
- • Mesh size : 0.02um*0.02um*0.02um
- • Run for 1248 time step +
- • 10 additional cycle to get the steady state field
- • Calculate steady state field for Ey and Hx (Discretized Fourier transform)
- • x-y boundary use the upper-lower symmetric boundary condition. Z-direction user the APML as the boundary condition
Figure 3: Simulation parameters
Simulation results
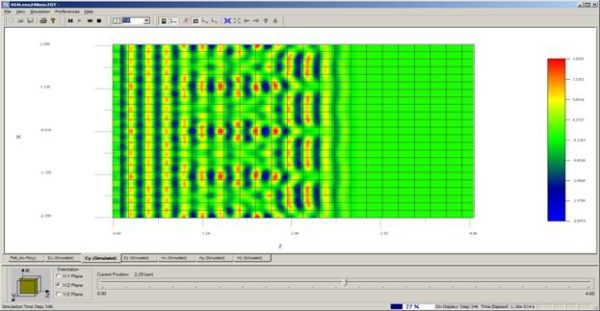
As shown in figure 4, in the simulation we can observe the time domain response in each slice in three orientations ( xy plane, yz plane, xz plane)
Figure 4: Time domain response in xz plane
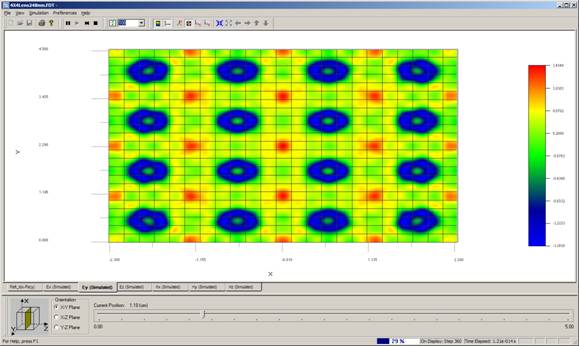
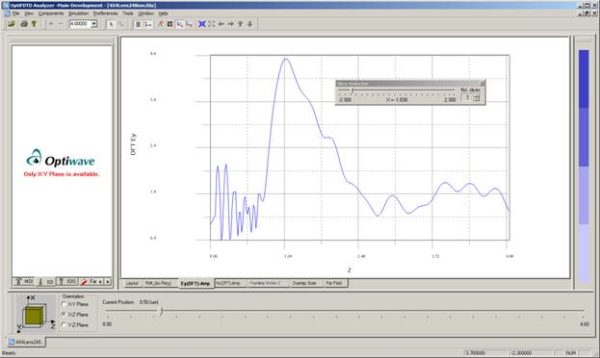
Steady state response can be observed in analyzer as shown figure 5. Beam size and focus distance can be measured in OptiFDTD as shown in figure 6
Figure 5: Field pattern in xy plane
Figure 6: Field pattern in xz plane
The calculation shows that each lens focuses at z=1.26, focus distance 1.26-0.8=0.46um

