The objective of this lesson is to demonstrate the performance of ytterbium-doped fiber amplifiers.
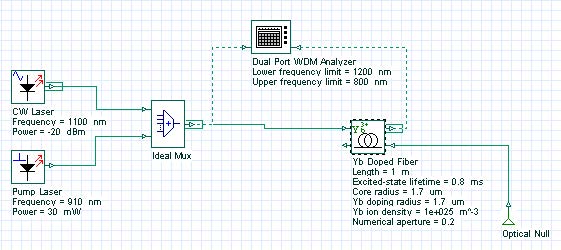
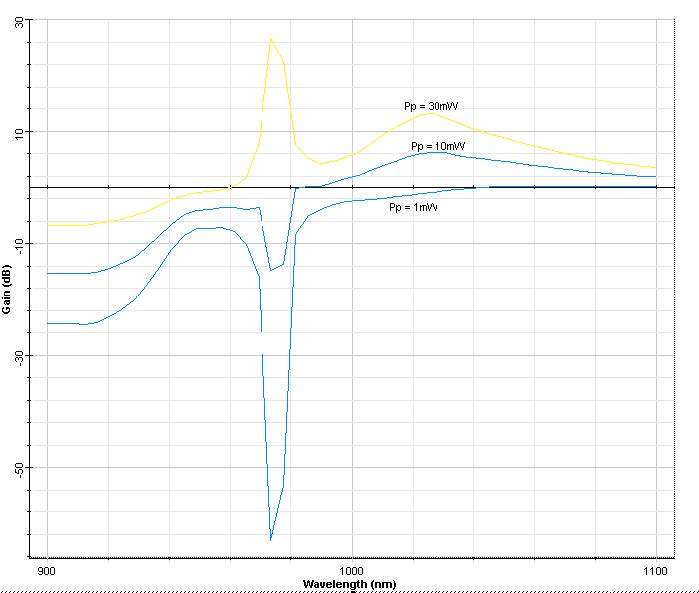
First of all, the gain spectra are analyzed for the pump wavelength at 910 nm and with different input pump powers: 1mW, 10mW and 30mW. The system used in the simulation is shown in Figure 1.
Figure 1: System layout for gain analysis
Figure 2 shows signal gain spectra obtained for three different pump powers.
The parameters used in this simulation are displayed in Figure 1, and they have similar values to those presented in [1], except with regard to the values of the absorption and emission cross-sections. Nevertheless, the results found are in good agreement with the results presented in [1].
Figure 2: Amplifier gain spectra for three different input pump powers
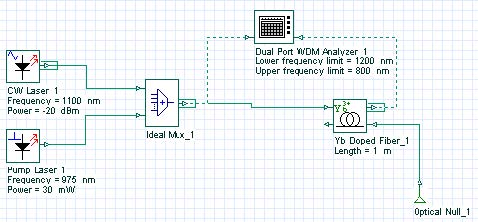
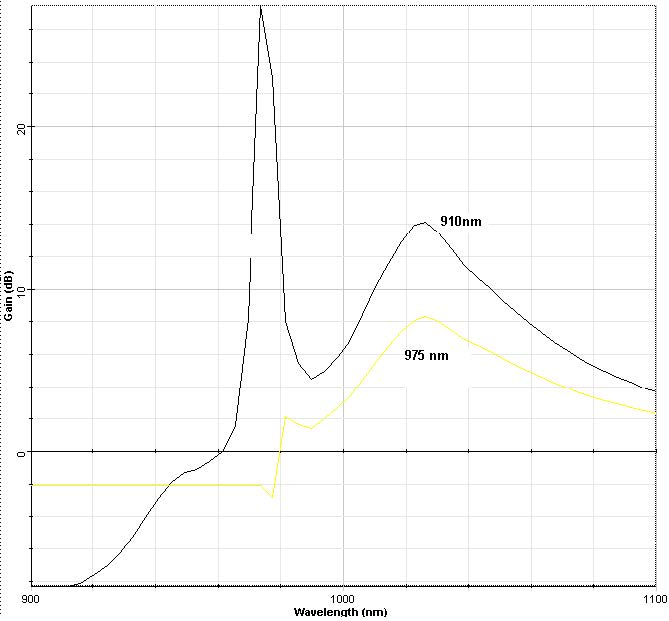
In a second case, the gain spectra are calculated for two different pump wavelengths, 910nm and 975nm. The system layout simulated is showed in Figure 3, and the fiber parameters used are similar to the parameters used in the previous example.
Figure 3: System layout
The results obtained in the simulation are shown in Figure 4.
Figure 4: Gain spectra obtained for pump wavelengths at 910 nm and 975 nm
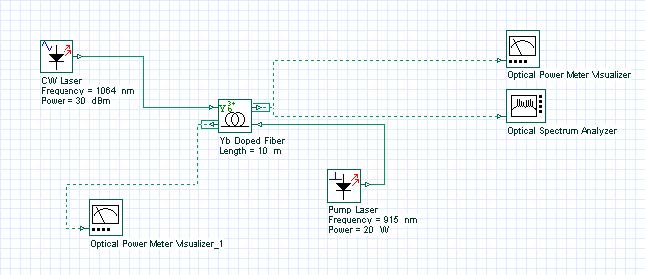
In the next case, the Ytterbium-doped fiber is double-clad. To set the ytterbium-doped fiber component to work as double-clad, the parameter Double-clad fiber (Enhanced tab) has to be set to True and the value of the pump reference has to be specified. The system used to simulate the double-clad fiber amplifier counter-pumped is shown in Figure 5.
Figure 5: Layout of double-clad fiber amplifier counter-pumped system
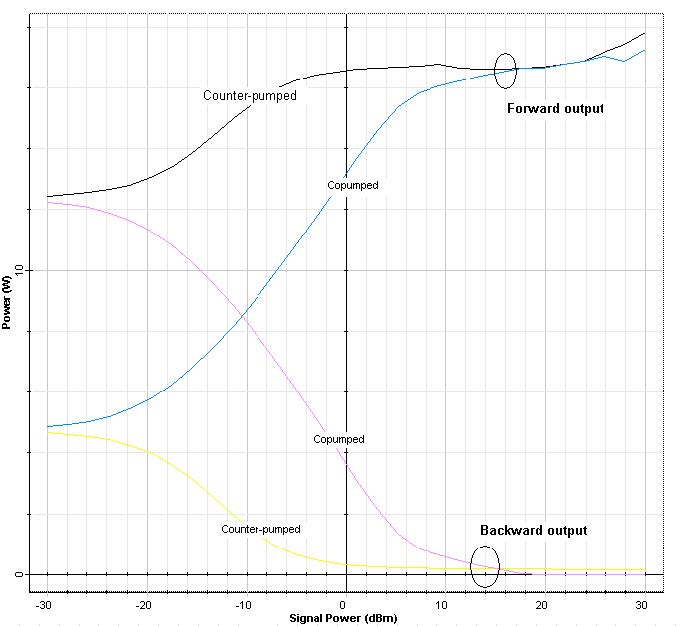
The EDF parameters used in this simulation are similar to those used in [2]. The forward and backward output power is calculated for input signal power varying from -30dBm to -30dBm for co-pumped and counter-pumped configurations. Figure 6 shows the results. This figure is equivalent to Figure 2 of [2].
Figure 6: Output power versus input signal power for different pump schemes
References:
[1]Paschotta, R.; Nilsson, J.; Tropper, A.C.; Hanna, D.C., “Ytterbium-doped fiber amplifiers”. IEEE Journal of Quantum Electronics, Vol.: 33, Issue: 7, Jul 1997, Pages: 1049-1056.
[2]Yong Wang; Hong Po, “Dynamic characteristics of double-clad fiber amplifiers for high-power pulse amplification”. IEEE Journal of Lightwave Technology, Vol.: 21, Issue: 10, Oct. 2003, Pages: 2262- 2270.


