In OptiGrating, all the parameters related to the grating can be scanned with the
Parameter Scan tool. It can help the user find optimized grating parameters to meet
the application requirements.
In this lesson, we will simulate a grating, which has a higher order Gaussian apodization profile. The FWHM of the grating apodization function will be scanned, and the spectrum properties, such as bandwidth, sidelobe, peak value, peak position, and dispersion at central wavelength are calculated. Based on the simulation results, the optimized FWHM value for suppressing the sidelobe can be obtained.
Note: The simulation of the following example may take 5 to 30 minutes. It depends on the speed of your computer.
Step 1
In this step, you will learn how to define a dispersion-shifted fiber profile.
| 1 | File > New. |
| 2 | In the New dialog box, click the Single Fiber option. |
| 3 | From the Parameters menu, click Fiber/Waveguide. |
| 4 | Delete default Regions core and cladding by highlighting them and then pressing the Remove button. |
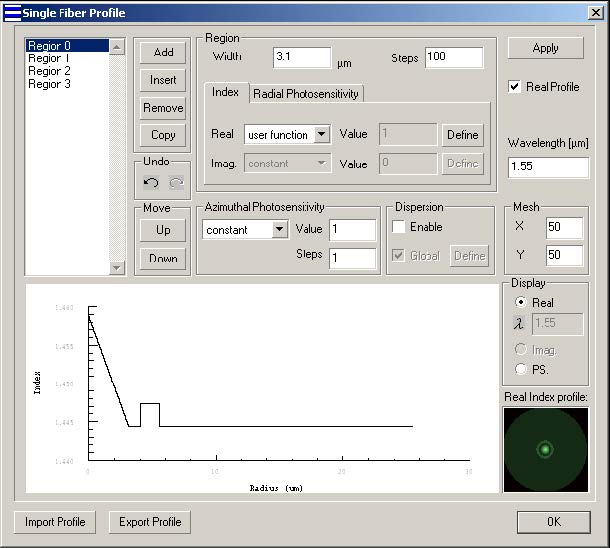
| 5 | In the Single Fiber Profile dialog box, add four regions: Region 0 through Region 3. |
For Region 0, enter the following data:
Width: 3.1
Real Index: user function.
The user function is defined as:
1.44439*sqrt(1+2*0.01*(1-x/WIDTH))
Radial Photosensitivity Type: constant
Radial Photosensitivity Value: 1.0
Steps: 100
For Region 1, enter the following data:
Width:0.9
Real Index: constant
Value: 1.44439
Radial Photosensitivity Type: constant
Radial Photosensitivity Value: 0.0
For Region 2, enter the following data:
Width: 1.5
Real Index: constant
Value: 1.44728
Radial Photosensitivity Type: constant
Radial Photosensitivity Value: 0.0
For Region 3, enter the following data:
Width: 20
Real Index: constant
Value: 1.44439
Radial Photosensitivity Type: constant
Radial Photosensitivity Value: 0.0
Use the default setting for other parameters.
Step 2
In this step, you will access a list of the calculated modes of the fiber. The fiber you
are using is a single mode fiber.
| 1 | From the Parameters Menu, click Mode…to open the Single Fiber Modes (multiple modes) dialog box. Here, you will see the calculated modes for the fiber defined in the previous steps. |
| 2 | In the Single Fiber Modes dialog box, select the LP(0,1) mode. |
| 3 | Click on the OK button. |
Step 3
In this step, you will define the grating parameters and learn how to define scan
parameters in the user-defined function.
To define the grating parameters
| 1 | In the Project Window, click the Grating Parameters button. |
| 2 | In the Grating Manager dialog box, double-click the listed grating to open the Grating Definition dialog box. |
| 3 | In the Length box, type 40000. |
| 4 | In the Ind. Mod. box, type 0.0002. |
| 5 | In the Number Of Segment box, type 250. |
| 6 | From the Apodization list box choose user defined, and press the Define button. |
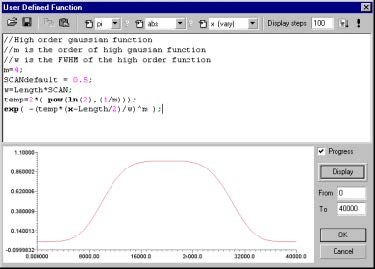
| 7 | In the edit window of the User Defined Function dialog box, define the user defined function as:
//Higher order Gaussian function where the SCAN parameter is the normalised FWHM of the apodization function. |
| 8 | Click the OK button to close the Grating Definition dialog box, and then click OK to close the OK button to close the Grating Manager dialog box. |
Note: The SCANdefault and SCAN are the key words in the user-defined
function. When you do Scan Calculation, the value of SCAN is changing. For
other calculations (Propagation, Spectrum, Pulse Response), the value of SCAN
is equal to the value of SCANdefault.
Step 4
In this step, you will perform a Spectrum calculation. The SCAN value is equal to the
SCANdefault value.
| 1 | In the Project Window, from the Calculation list box, select Spectrum. |
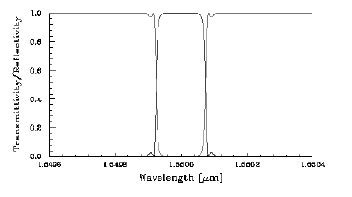
| 2 | In the From box, type 1.5496 to set the beginning point of the calculation range. |
| 3 | In the To box, type 1.5504 to set the end point of the calculation range. |
| 4 | In the Steps box, type 1000 to assign many points for calculation. |
| 5 | Click the Calculate button. |
| 6 | Right click on the graph and choose Axis Properties. |
| 7 | Select the Left Y axis tab and then deselect the Show as dB check box. |
| 8 | Click OK. |
When the Power tab is enabled, your graph should look like this:
Note: This step is important for the Scan calculation. The parameters set in this
step will be used in the Scan calculation. Choose proper From, To and Steps
parameters, so that the calculated spectra peaks are located around the center
of the calculation window.
Step 5
In this step, you will perform a Scan calculation and see the final results
| 1 | From the Calculation menu, select Scan. |
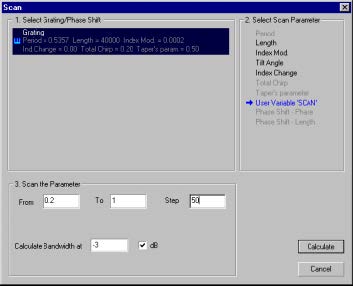
| 2 | In the Scan dialog box, select User Variable ‘SCAN’ in the Select Scan Parameter section. |
| 3 | In the From box, type 0.2 to set the beginning value of the scanning parameter. |
| 4 | In the To box, type 1.0 to set the ending value of the scanning parameter. |
| 5 | In the Steps box, type 50 to set the calculation steps. |
| 6 | In the Calculate Bandwidth at box, type –3, and enable the dB check box. |
| 7 | Press Calculation button. |
| 8 | After the Calculation is done, click the Scan tab in the Multiple View window. |
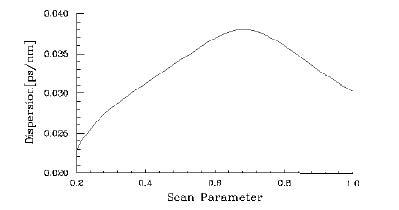
| 9 | By double clicking on the Scan graph, you can display Bandwidth, Sidelobe, Peak value, Peak position, and Dispersion at Central Wavelength. |
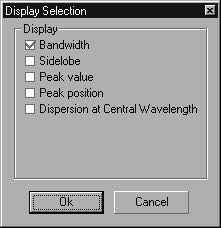
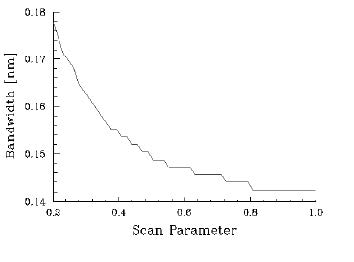
| 10 | Enable the bandwidth check box in the Display Selection dialog box. You will see the results show Bandwidth vs. Scan Parameter. When the FWHM of the apodization function increases, the effective length of the grating increases, and the bandwidth will decrease. |
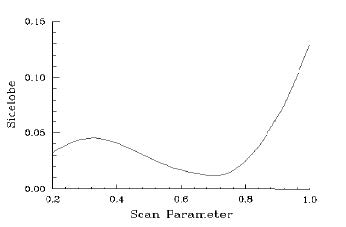
| 11 | Enable the Sidelobe check box in the Display Selection dialog box. You will see the results show sidelob vs. Scan Parameter. The results show the optimized FWHM for suppressing sidelobe is 0.712. In this case, the sidelobe reaches a minimum value of 0.0105. |
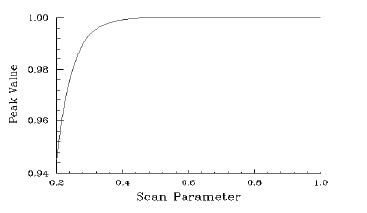
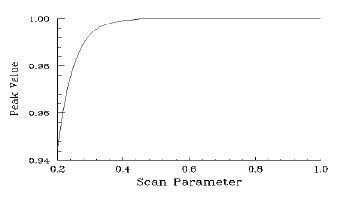
| 12 | Enable the Peak value check box in the Display Selection dialog box. You will see the results show peak value vs. Scan Parameter. When the FWHM of the apodization increases, the index modulation along the grating increases, so the peak value (maximum reflectivity) will increase. |
| 13 | Enable the Peak position check box in the Display Selection dialog box. You will see the results show peak position vs. Scan Parameter. During the parameter scan calculation, the grating period is a constant; so peak position (Central wavelength) is not changing with the scan parameter. |
| 14 | Enable the Dispersion at Central Wavelength check box in the Display Selection dialog box. You will see the result shows dispersion vs. Scan Parameter. |