
- This topic has 31 replies, 10 voices, and was last updated 8 years ago by
 Rajguru M. Mohan.
-
AuthorPosts
-
-
April 1, 2016 at 2:16 pm #34338
 jyoti rainaSpectator
hi evryone…i am facing a problem in plotting a graph for 4 receivers in my system…
i have to compare there ber and qualtiy factor with respect to fiber distance n power levels..but i want to show ber or quality factor of all 4 receivers on the same graph…bt i m not able to plot it…i am not finding it anywhr..can any1 plz tel me whr i can do that..i nreally need help in that..plz help..i vil be very thankful..
thanx in advance -
April 1, 2016 at 2:36 pm #34347
 FAYIQA NAQSHBANDISpectator
HELLO JYOTI RAINA..
Well if you are talking about plotting BER and Q-factor against two quantities which are power and fiber distance at the same time then it is not possible for now in optisystem graphs..This problem of not being able to plot various parameters for more than one transmitters or receivers has been mentioned quite often.. Now what you can do is use the excel option for plotting such graphs.. I hope it helps you to some extent.
Thanks & regards-
April 1, 2016 at 3:02 pm #34362jyoti rainaSpectator
hello fayiqa mam…thanx for replying.. i understand that it is not possible bt i have tried to plot but i can use only one axis at time…it seems just like plotting one parametr against anothr many times…can we directly import from optisystem to excel..i am confused why it is happening…
-
-
April 1, 2016 at 2:37 pm #34348
 aasif bashir darParticipant
hi joyti raina ,
i think you are able to provide the sweeps of fiber length… and are able to plot opti 2D graph for each of the individuall channel…
if sooooo….then export the the graph of each channel in text format…..
then import the three expoetrted files in the 4th opti @D gragh…
with regards-
April 1, 2016 at 3:08 pm #34365jyoti rainaSpectator
hi aasif sir…thanx for relying n ur kind concern..
i am very confused…when i try to plot min ber vs power of ber analyzer 1 to 4 then i can’t get it on single graph..can u plz help me out how i wil be able to do that..i need it fr checking n comparing it with each othr.
-
-
April 1, 2016 at 2:40 pm #34349aasif bashir darParticipant
there is one more option you can do.
just export all the four graphs in pairwise text format… then open each text file and copy the data and arrange the data in any spreadsheet software for example microsoft excel then plot the graph..
if you have problems in plot multiple graphs in excel jus watch any videos in the youtube…
with regards-
April 2, 2016 at 3:32 pm #34661jyoti rainaSpectator
thanx aasif sir fr the help..m thankful n it helped a lot..
thanx agn
-
-
April 1, 2016 at 2:42 pm #34351aasif bashir darParticipant
here are the links for videos
with regards
-
April 2, 2016 at 3:33 pm #34663jyoti rainaSpectator
thanx a tonn aasif sir..
-
-
April 1, 2016 at 2:47 pm #34354aasif bashir darParticipant
hi joyti raina,
i want to clear the point of fayiqa nashbandi that there is not problem in plotting the simultaneosly many graphs on single opti2D graph..
but there is problem in providing the proper designation or legends to each of the respective graph on the opti 2D gragh..
with reagrsd -
April 1, 2016 at 2:49 pm #34356FAYIQA NAQSHBANDISpectator
HI AASIF..
I think the best possible way for her is to go for the plotting the graphs in excel only..because only there she can plot for 4 receivers on a single graph and taking more than two parameters at the same time… Optisystem graph system should be updated where it is possible…Anyway i guess she has gotten some idea now..
Thanks & regards -
April 1, 2016 at 2:52 pm #34358aasif bashir darParticipant
you are welcome fayiqa nashbandi
-
April 1, 2016 at 3:09 pm #34367jyoti rainaSpectator
thanx aasif sir fr sharing thz vidz…these r really helpful in case m nt able to do it in optisystemm..this wil really help..thanx 1c agn
-
April 1, 2016 at 3:14 pm #34370
 umer syedParticipant
very well explained by the asif bashir dar, about the provisions of simultaneous plotting the graphs in the opti2Dgraph and in the excel with proper vodeoes references.
also there is leggendind problem in the optisytem.
with regards
-
April 2, 2016 at 3:34 pm #34664jyoti rainaSpectator
thanx for the reply..
-
-
April 1, 2016 at 3:19 pm #34372
Atul Sharma
ParticipantHi everybody. Greetings.
It is an interesting question but i would like to suggest you to visit https://optiwave.com/optifiber-manuals/optical-fiber-opti2d-graph-control/
for help. This will clearly help you in learning about how different parameters can be plotted together in a graph. You may easily try it out and i bet you will be all clear after going through it. I hope you find it useful.Regards
Atul Sharma-
April 1, 2016 at 3:50 pm #34393
 ZULKARNAINParticipant
hi atul sharma…
thank you for attaching the link.indeed it is a very good explanation for plotting different parameters together in a graph.
with regards -
April 2, 2016 at 3:35 pm #34665jyoti rainaSpectator
thanx atul sharma sir..the link wz informative..thnx agn
-
-
April 1, 2016 at 3:25 pm #34377
 SAHIL SINGHParticipant
Hi all,
I agree with umer syed about the nice and detailed explanation by asif… Can someone please explain about the leggendind problem in the optisytem ?
Regards
Sahil Singh-
April 2, 2016 at 3:37 pm #34667jyoti rainaSpectator
hi sahil singh..excel is good option..thanx anyway
-
-
April 1, 2016 at 3:44 pm #34388aasif bashir darParticipant
you are all welcome
-
April 1, 2016 at 3:49 pm #34392aasif bashir darParticipant
hi atul sharma,
the link you have posted is for optifiber software….https://optiwave.com/optifiber-manuals/optical-fiber-opti2d-graph-control/but we are talking about optisystem.. do not take the discussion to another softwave of optiwave,,,such things create confusion..
with regards-
April 3, 2016 at 11:28 pm #35128jyoti rainaSpectator
thanx anyway to u..
-
-
April 1, 2016 at 4:36 pm #34413
 Aabid BabaParticipant
Hi All,
The problem faced by jyoti raina has been already discussed in previous posts on the forum. There is problem with the legends as aasif has already mentioned in the above post. But still you can find it useful for your requirement and i hope you will also try looking at the other option of the excel thing which is not so difficult also. I hope it all would help you.
Regards-
April 2, 2016 at 3:38 pm #34669jyoti rainaSpectator
tahnx aabid sir fr ur suggestions…i wil take that..
-
April 3, 2016 at 9:30 am #34856Aabid BabaParticipant
You are welcome jyoti.
-
April 3, 2016 at 11:29 pm #35129jyoti rainaSpectator
thank u sir.
-
-
-
April 2, 2016 at 3:36 pm #34666SAHIL SINGHParticipant
Hi asif Bashir,
Infact i was also confused by the link which was posted by atul sharma.. We should try to keep the discussion focussed on a particular topic and not divert much towards the different topics..
Regards
Sahil Singh -
April 2, 2016 at 3:40 pm #34670jyoti rainaSpectator
yes i agree bt stil it was helpful link.
-
April 3, 2016 at 9:40 am #34864aasif bashir darParticipant
you are welcome jyoti raina…cheers that you got some conclusion about your query
with regards
-
April 4, 2016 at 5:55 am #35184
 Ranjeet KumarParticipant
Hi Jyoti,
You can excel for the above problems.
In excel we can plot 3 or 4 different types of legend lines on same graphs.
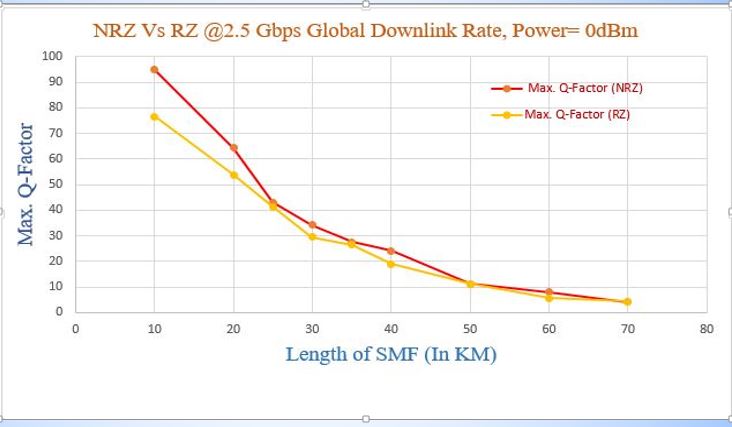
You should plot the graph of BER for all four receivers vs input Power in dbm and you will see the comparison itself.
Similarly you could plot the graph of Q-factor vs input power in dbm and compare the results.
you could plot the graph of Q-factor vs transmission distance and compare the results.
I am posting the image which i have made using excel.Attachments:
-
April 15, 2016 at 7:31 am #36882
 Rajguru M. MohanParticipant
Hi Jyoti,
I agree to the points of Ranjeet that we can use excel for the plotting graphs of more than design in same graph layout .
In excel we can plot 3 or 4 different types of legend lines on same graphs.
You could draw all 4 users BER and Q-factor values vs Fiber length and input power in two different graph layout.
Variables on both axes should be unique.
Hope my suggestion will work
-
-
AuthorPosts
- You must be logged in to reply to this topic.